chapter - 1 introduction - Meghalaya State Pollution Control Board
chapter - 1 introduction - Meghalaya State Pollution Control Board
chapter - 1 introduction - Meghalaya State Pollution Control Board

Create successful ePaper yourself
Turn your PDF publications into a flip-book with our unique Google optimized e-Paper software.
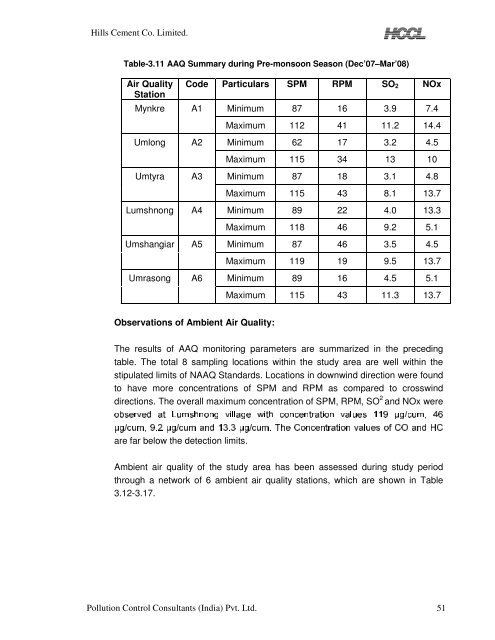
Hills Cement Co. Limited.<br />
Table-3.11 AAQ Summary during Pre-monsoon Season (Dec’07–Mar’08)<br />
Air Quality<br />
Station<br />
Mynkre<br />
Code Particulars SPM RPM SO 2 NOx<br />
A1<br />
Minimum 87 16 3.9 7.4<br />
Umlong<br />
Umtyra<br />
Lumshnong<br />
Umshangiar<br />
Umrasong<br />
A2<br />
A3<br />
A4<br />
A5<br />
A6<br />
Maximum 112 41 11.2 14.4<br />
Minimum 62 17 3.2 4.5<br />
Maximum 115 34 13 10<br />
Minimum 87 18 3.1 4.8<br />
Maximum 115 43 8.1 13.7<br />
Minimum 89 22 4.0 13.3<br />
Maximum 118 46 9.2 5.1<br />
Minimum 87 46 3.5 4.5<br />
Maximum 119 19 9.5 13.7<br />
Minimum 89 16 4.5 5.1<br />
<br />
Observations of Ambient Air Quality:<br />
Maximum 115 43 11.3 13.7<br />
The results of AAQ monitoring parameters are summarized in the preceding<br />
table. The total 8 sampling locations within the study area are well within the<br />
stipulated limits of NAAQ Standards. Locations in downwind direction were found<br />
to have more concentrations of SPM and RPM as compared to crosswind<br />
directions. The overall maximum concentration of SPM, RPM, SO 2 and NOx were<br />
REVHUYHG DW /XPVKQRQJ YLOODJH ZLWK FRQFHQWUDWLRQ YDOXHV JFXP <br />
JFXPJFXPDQGJFXP7KH&RQFHQWUDWLRQYDOXHVRI&2DQG+&<br />
are far below the detection limits.<br />
Ambient air quality of the study area has been assessed during study period<br />
through a network of 6 ambient air quality stations, which are shown in Table<br />
3.12-3.17.<br />
<strong>Pollution</strong> <strong>Control</strong> Consultants (India) Pvt. Ltd. 51
![[FORM I] - Meghalaya State Pollution Control Board](https://img.yumpu.com/49771786/1/190x245/form-i-meghalaya-state-pollution-control-board.jpg?quality=85)