Annual Report - CoBank
Annual Report - CoBank
Annual Report - CoBank
Create successful ePaper yourself
Turn your PDF publications into a flip-book with our unique Google optimized e-Paper software.
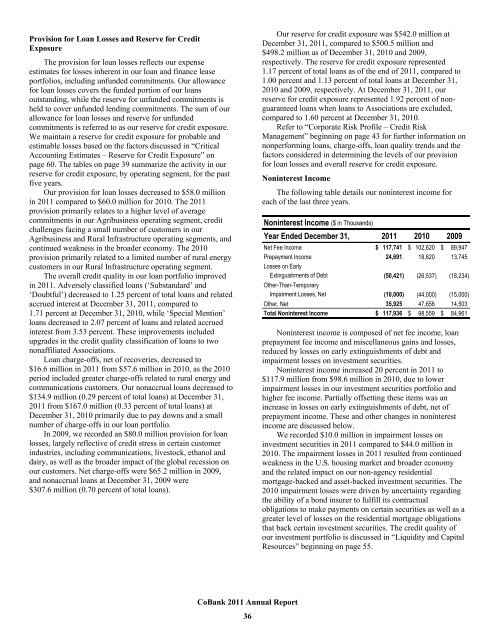
Provision for Loan Losses and Reserve for CreditExposureThe provision for loan losses reflects our expenseestimates for losses inherent in our loan and finance leaseportfolios, including unfunded commitments. Our allowancefor loan losses covers the funded portion of our loansoutstanding, while the reserve for unfunded commitments isheld to cover unfunded lending commitments. The sum of ourallowance for loan losses and reserve for unfundedcommitments is referred to as our reserve for credit exposure.We maintain a reserve for credit exposure for probable andestimable losses based on the factors discussed in “CriticalAccounting Estimates – Reserve for Credit Exposure” onpage 60. The tables on page 39 summarize the activity in ourreserve for credit exposure, by operating segment, for the pastfive years.Our provision for loan losses decreased to $58.0 millionin 2011 compared to $60.0 million for 2010. The 2011provision primarily relates to a higher level of averagecommitments in our Agribusiness operating segment, creditchallenges facing a small number of customers in ourAgribusiness and Rural Infrastructure operating segments, andcontinued weakness in the broader economy. The 2010provision primarily related to a limited number of rural energycustomers in our Rural Infrastructure operating segment.The overall credit quality in our loan portfolio improvedin 2011. Adversely classified loans (‘Substandard’ and‘Doubtful’) decreased to 1.25 percent of total loans and relatedaccrued interest at December 31, 2011, compared to1.71 percent at December 31, 2010, while ‘Special Mention’loans decreased to 2.07 percent of loans and related accruedinterest from 3.53 percent. These improvements includedupgrades in the credit quality classification of loans to twononaffiliated Associations.Loan charge-offs, net of recoveries, decreased to$16.6 million in 2011 from $57.6 million in 2010, as the 2010period included greater charge-offs related to rural energy andcommunications customers. Our nonaccrual loans decreased to$134.9 million (0.29 percent of total loans) at December 31,2011 from $167.0 million (0.33 percent of total loans) atDecember 31, 2010 primarily due to pay downs and a smallnumber of charge-offs in our loan portfolio.In 2009, we recorded an $80.0 million provision for loanlosses, largely reflective of credit stress in certain customerindustries, including communications, livestock, ethanol anddairy, as well as the broader impact of the global recession onour customers. Net charge-offs were $65.2 million in 2009,and nonaccrual loans at December 31, 2009 were$307.6 million (0.70 percent of total loans).Our reserve for credit exposure was $542.0 million atDecember 31, 2011, compared to $500.5 million and$498.2 million as of December 31, 2010 and 2009,respectively. The reserve for credit exposure represented1.17 percent of total loans as of the end of 2011, compared to1.00 percent and 1.13 percent of total loans at December 31,2010 and 2009, respectively. At December 31, 2011, ourreserve for credit exposure represented 1.92 percent of nonguaranteedloans when loans to Associations are excluded,compared to 1.60 percent at December 31, 2010.Refer to “Corporate Risk Profile – Credit RiskManagement” beginning on page 43 for further information onnonperforming loans, charge-offs, loan quality trends and thefactors considered in determining the levels of our provisionfor loan losses and overall reserve for credit exposure.Noninterest IncomeThe following table details our noninterest income foreach of the last three years.Noninterest Income ($ in Thousands)Year Ended December 31, 2011 2010 2009Net Fee Income $ 117,741 $ 102,620 $ 89,947Prepayment Income 24,691 18,820 13,745Losses on EarlyExtinguishments of Debt(50,421) (26,537) (18,234)Other-Than-TemporaryImpairment Losses, Net(10,000) (44,000) (15,000)Other, Net 35,925 47,656 14,503Total Noninterest Income $ 117,936 $ 98,559 $ 84,961Noninterest income is composed of net fee income, loanprepayment fee income and miscellaneous gains and losses,reduced by losses on early extinguishments of debt andimpairment losses on investment securities.Noninterest income increased 20 percent in 2011 to$117.9 million from $98.6 million in 2010, due to lowerimpairment losses in our investment securities portfolio andhigher fee income. Partially offsetting these items was anincrease in losses on early extinguishments of debt, net ofprepayment income. These and other changes in noninterestincome are discussed below.We recorded $10.0 million in impairment losses oninvestment securities in 2011 compared to $44.0 million in2010. The impairment losses in 2011 resulted from continuedweakness in the U.S. housing market and broader economyand the related impact on our non-agency residentialmortgage-backed and asset-backed investment securities. The2010 impairment losses were driven by uncertainty regardingthe ability of a bond insurer to fulfill its contractualobligations to make payments on certain securities as well as agreater level of losses on the residential mortgage obligationsthat back certain investment securities. The credit quality ofour investment portfolio is discussed in “Liquidity and CapitalResources” beginning on page 55.<strong>CoBank</strong> 2011 <strong>Annual</strong> <strong>Report</strong>36


