Net fee income grew to $117.7 million in 2011 from$102.6 million in 2010. The increase in fee income wasprimarily driven by greater arrangement fees earned on loantransactions in our agribusiness and rural energy portfolios,where many customers refinanced their loans to takeadvantage of lower market interest rates.Prepayment income increased to $24.7 million in 2011from $18.8 million in 2010 due to a higher level of customerrefinancing resulting from the low interest rate environment.We extinguish debt to offset the current and prospectiveimpact of prepayments in our loan and investment portfoliosand to maintain a desired mix of interest-earning assets andinterest-bearing liabilities. During 2011, we extinguished$649.3 million of debt compared to $235.7 million in 2010.Losses on these early extinguishments of debt were$50.4 million in 2011 compared to $26.5 million in 2010. Thisincrease resulted from a higher level of debt extinguishmentsin an effort to achieve the desired mix of interest-bearingliabilities in a low interest rate environment.Other noninterest income decreased to $35.9 million in2011 compared to $47.7 million in 2010. The 2010 amountincluded $33.3 million in premium refunds from the FarmCredit System Insurance Corporation (Insurance Corporation)related to the Farm Credit Insurance Fund (Insurance Fund).There were no Insurance Fund premium refunds during 2011.As described in Note 5 to the accompanying consolidatedfinancial statements, when the Insurance Fund exceeds thestatutory 2 percent secure base amount (SBA), the InsuranceCorporation is required to reduce premiums and may refundexcess amounts. Other noninterest income for 2011 included a$10.0 million increase in customer derivative income drivenby customers locking-in or protecting their term funding costsin the low interest rate environment and a $4.5 million gain onthe sale of one of our previously impaired investmentsecurities.Total noninterest income increased by $13.6 million, or16 percent, in 2010 from $85.0 million in 2009. The increasein 2010 noninterest income included the previously mentionedrefunds of Insurance Fund premiums. In addition, fee incomeimproved by $12.7 million in 2010, primarily driven byincreased arrangement fees earned on loan transactions in ourcommunications and rural energy portfolios. Partiallyoffsetting these items were $29.0 million in increasedimpairment losses in 2010 as compared to 2009.Operating ExpensesThe following table details our operating expenses foreach of the last three years.Analysis of Operating Expenses ($ in Thousands)Year Ended December 31, 2011 2010 2009Employee Compensation $ 117,531 $ 98,971 $ 101,868Insurance Fund Premium 20,245 13,281 53,968Information Services 18,846 16,115 16,387General and Administrative 25,415 42,789 17,093Purchased Services 18,958 20,559 7,578Occupancy and Equipment 7,404 6,479 6,806Travel and Entertainment 12,425 10,922 8,895Farm Credit System Related 7,446 7,094 6,636Total Operating Expenses $ 228,270 $ 216,210 $ 219,231Total Operating Expenses/(Net Interest Income +Net Fee Income)19.2 % 20.5 % 21.2 %Operating Expenses, Net ofInsurance Fund Premium/(Net Interest Income +Net Fee Income)17.5 19.3 16.0Total operating expenses increased 6 percent in 2011 to$228.3 million, compared to $216.2 million for 2010, due toincreases in employee compensation expenses, Insurance Fundpremiums and expenses related to the merger with AgBank.Employee compensation expense, which primarilyincludes salaries, incentive compensation and employeebenefits, increased 19 percent in 2011 to $117.5 million,largely due to higher incentive compensation expense relatedto stronger financial performance and increased employeestaffing levels. As of December 31, 2011, we employed762 associates, compared to 719 and 698 at December 31,2010 and 2009, respectively.The increase in Insurance Fund premium expense resultedfrom an increase in premium rates for 2011, which were sixbasis points of average outstanding adjusted insured debtobligations, compared to five basis points for 2010. To a lesserextent, the increase also resulted from an increase in insureddebt obligations which funded the increase in average loanvolume.General and administrative expenses decreased to$25.4 million in 2011 from $42.8 million in 2010, as the 2010period included costs related to the settlement of a businessdispute in our Rural Infrastructure operating segment. Generaland administrative expenses in 2011 included $3.2 million inmerger-related expenses.<strong>CoBank</strong> 2011 <strong>Annual</strong> <strong>Report</strong>37
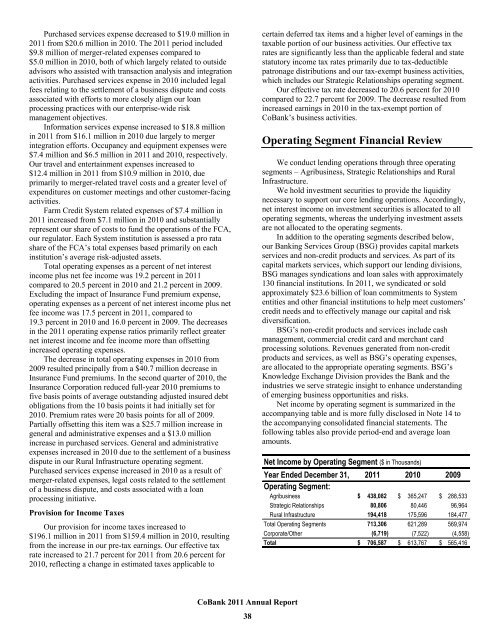
Purchased services expense decreased to $19.0 million in2011 from $20.6 million in 2010. The 2011 period included$9.8 million of merger-related expenses compared to$5.0 million in 2010, both of which largely related to outsideadvisors who assisted with transaction analysis and integrationactivities. Purchased services expense in 2010 included legalfees relating to the settlement of a business dispute and costsassociated with efforts to more closely align our loanprocessing practices with our enterprise-wide riskmanagement objectives.Information services expense increased to $18.8 millionin 2011 from $16.1 million in 2010 due largely to mergerintegration efforts. Occupancy and equipment expenses were$7.4 million and $6.5 million in 2011 and 2010, respectively.Our travel and entertainment expenses increased to$12.4 million in 2011 from $10.9 million in 2010, dueprimarily to merger-related travel costs and a greater level ofexpenditures on customer meetings and other customer-facingactivities.Farm Credit System related expenses of $7.4 million in2011 increased from $7.1 million in 2010 and substantiallyrepresent our share of costs to fund the operations of the FCA,our regulator. Each System institution is assessed a pro ratashare of the FCA’s total expenses based primarily on eachinstitution’s average risk-adjusted assets.Total operating expenses as a percent of net interestincome plus net fee income was 19.2 percent in 2011compared to 20.5 percent in 2010 and 21.2 percent in 2009.Excluding the impact of Insurance Fund premium expense,operating expenses as a percent of net interest income plus netfee income was 17.5 percent in 2011, compared to19.3 percent in 2010 and 16.0 percent in 2009. The decreasesin the 2011 operating expense ratios primarily reflect greaternet interest income and fee income more than offsettingincreased operating expenses.The decrease in total operating expenses in 2010 from2009 resulted principally from a $40.7 million decrease inInsurance Fund premiums. In the second quarter of 2010, theInsurance Corporation reduced full-year 2010 premiums tofive basis points of average outstanding adjusted insured debtobligations from the 10 basis points it had initially set for2010. Premium rates were 20 basis points for all of 2009.Partially offsetting this item was a $25.7 million increase ingeneral and administrative expenses and a $13.0 millionincrease in purchased services. General and administrativeexpenses increased in 2010 due to the settlement of a businessdispute in our Rural Infrastructure operating segment.Purchased services expense increased in 2010 as a result ofmerger-related expenses, legal costs related to the settlementof a business dispute, and costs associated with a loanprocessing initiative.Provision for Income TaxesOur provision for income taxes increased to$196.1 million in 2011 from $159.4 million in 2010, resultingfrom the increase in our pre-tax earnings. Our effective taxrate increased to 21.7 percent for 2011 from 20.6 percent for2010, reflecting a change in estimated taxes applicable tocertain deferred tax items and a higher level of earnings in thetaxable portion of our business activities. Our effective taxrates are significantly less than the applicable federal and statestatutory income tax rates primarily due to tax-deductiblepatronage distributions and our tax-exempt business activities,which includes our Strategic Relationships operating segment.Our effective tax rate decreased to 20.6 percent for 2010compared to 22.7 percent for 2009. The decrease resulted fromincreased earnings in 2010 in the tax-exempt portion of<strong>CoBank</strong>’s business activities.Operating Segment Financial ReviewWe conduct lending operations through three operatingsegments – Agribusiness, Strategic Relationships and RuralInfrastructure.We hold investment securities to provide the liquiditynecessary to support our core lending operations. Accordingly,net interest income on investment securities is allocated to alloperating segments, whereas the underlying investment assetsare not allocated to the operating segments.In addition to the operating segments described below,our Banking Services Group (BSG) provides capital marketsservices and non-credit products and services. As part of itscapital markets services, which support our lending divisions,BSG manages syndications and loan sales with approximately130 financial institutions. In 2011, we syndicated or soldapproximately $23.6 billion of loan commitments to Systementities and other financial institutions to help meet customers’credit needs and to effectively manage our capital and riskdiversification.BSG’s non-credit products and services include cashmanagement, commercial credit card and merchant cardprocessing solutions. Revenues generated from non-creditproducts and services, as well as BSG’s operating expenses,are allocated to the appropriate operating segments. BSG’sKnowledge Exchange Division provides the Bank and theindustries we serve strategic insight to enhance understandingof emerging business opportunities and risks.Net income by operating segment is summarized in theaccompanying table and is more fully disclosed in Note 14 tothe accompanying consolidated financial statements. Thefollowing tables also provide period-end and average loanamounts.Net Income by Operating Segment ($ in Thousands)Year Ended December 31, 2011 2010 2009Operating Segment:Agribusiness $ 438,082 $ 365,247 $ 288,533Strategic Relationships 80,806 80,446 96,964Rural Infrastructure 194,418 175,596 184,477Total Operating Segments 713,306 621,289 569,974Corporate/Other (6,719) (7,522) (4,558)Total $ 706,587 $ 613,767 $ 565,416<strong>CoBank</strong> 2011 <strong>Annual</strong> <strong>Report</strong>38
- Page 4 and 5: Everett DobrinskiChairmanRobert B.
- Page 6 and 7: “ We firmly believe the combined
- Page 8 and 9: associations are partnering with Co
- Page 11 and 12: 2012 BOARD OF DIRECTORSOccupation:F
- Page 13 and 14: “WE ARE COMMITTEDTO GOOD GOVERNAN
- Page 15 and 16: U.S. AgBank CEO Darryl Rhodes (fron
- Page 17 and 18: KansasNew MexicoUtahFC of Ness City
- Page 19 and 20: CorporateCitizenshipAT COBANKSuppor
- Page 21 and 22: StrategicRelationshipsFarm Credit o
- Page 23 and 24: RegionalAgribusinessBANKING GROUPCe
- Page 25 and 26: CorporateAgribusinessBANKING GROUPK
- Page 27 and 28: ElectricDistributionBANKING DIVISIO
- Page 29 and 30: Power SupplyBANKING DIVISIONTri-Sta
- Page 31 and 32: IndustryPortfoliosCoBank ended 2011
- Page 33 and 34: CoBank is a financially strong,depe
- Page 35 and 36: 30COBANK 2011ANNUAL REPORTbuilding
- Page 37 and 38: The information and disclosures con
- Page 39 and 40: Financial Condition andResults of O
- Page 41: Provision for Loan Losses and Reser
- Page 45 and 46: AgribusinessOverviewThe Agribusines
- Page 47 and 48: Rural InfrastructureOverviewThe Rur
- Page 49 and 50: Credit ApprovalThe most critical el
- Page 51 and 52: Total nonaccrual loans were $134.9
- Page 53 and 54: Basis RiskBasis risk arises due to
- Page 55 and 56: Our net interest income is lower in
- Page 57 and 58: The notional amount of our derivati
- Page 59 and 60: Reputation Risk ManagementReputatio
- Page 61 and 62: Investment Securities ($ in Million
- Page 63 and 64: In accordance with the Farm Credit
- Page 65 and 66: Critical Accounting EstimatesManage
- Page 67 and 68: Business OutlookWe closed our merge
- Page 69 and 70: Consolidated Income StatementsCoBan
- Page 71 and 72: Consolidated Statements of Cash Flo
- Page 73 and 74: Consolidated Statements of Changes
- Page 75 and 76: LoansWe report loans, excluding lea
- Page 77 and 78: If we determine that a derivative n
- Page 79 and 80: Reserve for Credit ExposureThe foll
- Page 81 and 82: The information in the tables under
- Page 83 and 84: The following tables present inform
- Page 85 and 86: At December 31, 2011, gross minimum
- Page 87 and 88: For impaired investment securities,
- Page 89 and 90: At December 31, 2011, the assets of
- Page 91 and 92: Preferred StockThe following table
- Page 93 and 94:
The following table provides a summ
- Page 95 and 96:
AssumptionsWe measure plan obligati
- Page 97 and 98:
Incentive Compensation PlansWe have
- Page 99 and 100:
Note 11 - Derivative FinancialInstr
- Page 101 and 102:
A summary of the impact of derivati
- Page 103 and 104:
Due to the uncertainty of expected
- Page 105 and 106:
Assets and Liabilities Measured atF
- Page 107 and 108:
Note 14 - Segment Financial Informa
- Page 109 and 110:
Note 15 - Commitments and Contingen
- Page 111 and 112:
Note 18 - Subsequent Events (Unaudi
- Page 113 and 114:
Supplemental District Financial Inf
- Page 115 and 116:
Supplemental District Financial Inf
- Page 117 and 118:
Report of Independent AuditorsCoBan
- Page 119 and 120:
Management’s Report on Internal C
- Page 121 and 122:
Annual Report to Shareholders Discl
- Page 123 and 124:
Board of Directors Disclosure as of
- Page 125 and 126:
Board of Directors Disclosure as of
- Page 127 and 128:
Board of Directors Disclosure as of
- Page 129 and 130:
Board of Directors Disclosure as of
- Page 131 and 132:
Senior OfficersCoBank, ACBRobert B.
- Page 133 and 134:
Senior Officers Compensation Discus
- Page 135 and 136:
Senior Officers Compensation Discus
- Page 137 and 138:
Senior Officers Compensation Discus
- Page 139 and 140:
Senior Officers Compensation Discus
- Page 141 and 142:
Senior Officers Compensation Discus
- Page 143 and 144:
Senior Officers Compensation Discus
- Page 145 and 146:
Code of EthicsCoBank, ACBCoBank set
- Page 147 and 148:
CERTIFICATIONI, Robert B. Engel, Pr
- Page 149 and 150:
LeadershipCoBank, ACBRobert B. Enge
- Page 151 and 152:
OfficeLocationsCoBank National Offi


