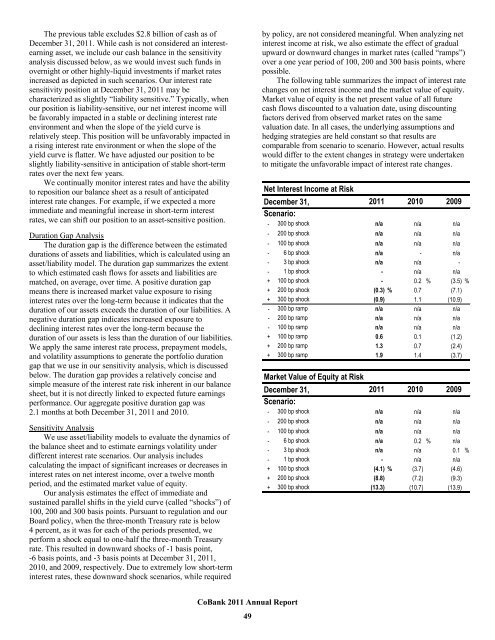
The previous table excludes $2.8 billion of cash as ofDecember 31, 2011. While cash is not considered an interestearningasset, we include our cash balance in the sensitivityanalysis discussed below, as we would invest such funds inovernight or other highly-liquid investments if market ratesincreased as depicted in such scenarios. Our interest ratesensitivity position at December 31, 2011 may becharacterized as slightly “liability sensitive.” Typically, whenour position is liability-sensitive, our net interest income willbe favorably impacted in a stable or declining interest rateenvironment and when the slope of the yield curve isrelatively steep. This position will be unfavorably impacted ina rising interest rate environment or when the slope of theyield curve is flatter. We have adjusted our position to beslightly liability-sensitive in anticipation of stable short-termrates over the next few years.We continually monitor interest rates and have the abilityto reposition our balance sheet as a result of anticipatedinterest rate changes. For example, if we expected a moreimmediate and meaningful increase in short-term interestrates, we can shift our position to an asset-sensitive position.Duration Gap AnalysisThe duration gap is the difference between the estimateddurations of assets and liabilities, which is calculated using anasset/liability model. The duration gap summarizes the extentto which estimated cash flows for assets and liabilities arematched, on average, over time. A positive duration gapmeans there is increased market value exposure to risinginterest rates over the long-term because it indicates that theduration of our assets exceeds the duration of our liabilities. Anegative duration gap indicates increased exposure todeclining interest rates over the long-term because theduration of our assets is less than the duration of our liabilities.We apply the same interest rate process, prepayment models,and volatility assumptions to generate the portfolio durationgap that we use in our sensitivity analysis, which is discussedbelow. The duration gap provides a relatively concise andsimple measure of the interest rate risk inherent in our balancesheet, but it is not directly linked to expected future earningsperformance. Our aggregate positive duration gap was2.1 months at both December 31, 2011 and 2010.Sensitivity AnalysisWe use asset/liability models to evaluate the dynamics ofthe balance sheet and to estimate earnings volatility underdifferent interest rate scenarios. Our analysis includescalculating the impact of significant increases or decreases ininterest rates on net interest income, over a twelve monthperiod, and the estimated market value of equity.Our analysis estimates the effect of immediate andsustained parallel shifts in the yield curve (called “shocks”) of100, 200 and 300 basis points. Pursuant to regulation and ourBoard policy, when the three-month Treasury rate is below4 percent, as it was for each of the periods presented, weperform a shock equal to one-half the three-month Treasuryrate. This resulted in downward shocks of -1 basis point,-6 basis points, and -3 basis points at December 31, 2011,2010, and 2009, respectively. Due to extremely low short-terminterest rates, these downward shock scenarios, while requiredby policy, are not considered meaningful. When analyzing netinterest income at risk, we also estimate the effect of gradualupward or downward changes in market rates (called “ramps”)over a one year period of 100, 200 and 300 basis points, wherepossible.The following table summarizes the impact of interest ratechanges on net interest income and the market value of equity.Market value of equity is the net present value of all futurecash flows discounted to a valuation date, using discountingfactors derived from observed market rates on the samevaluation date. In all cases, the underlying assumptions andhedging strategies are held constant so that results arecomparable from scenario to scenario. However, actual resultswould differ to the extent changes in strategy were undertakento mitigate the unfavorable impact of interest rate changes.Net Interest Income at RiskDecember 31,Scenario:201120102009- 300 bp shockn/a n/a n/a- 200 bp shockn/a n/a n/a- 100 bp shockn/a n/a n/a- 6 bp shockn/a - n/a- 3 bp shockn/a n/a -- 1 bp shock- n/a n/a+ 100 bp shock- 0.2 % (3.5) %+ 200 bp shock(0.3) % 0.7 (7.1)+ 300 bp shock(0.9) 1.1 (10.9)- 300 bp rampn/a n/a n/a- 200 bp rampn/a n/a n/a- 100 bp rampn/a n/a n/a+ 100 bp ramp0.6 0.1 (1.2)+ 200 bp ramp1.3 0.7 (2.4)+ 300 bp ramp1.9 1.4 (3.7)Market Value of Equity at RiskDecember 31,2011 2010 2009Scenario:- 300 bp shockn/a n/a n/a- 200 bp shockn/a n/a n/a- 100 bp shockn/a n/a n/a- 6 bp shockn/a 0.2 % n/a- 3 bp shockn/a n/a 0.1 %- 1 bp shock- n/a n/a+ 100 bp shock(4.1) % (3.7) (4.6)+ 200 bp shock(8.8) (7.2) (9.3)+ 300 bp shock(13.3) (10.7) (13.9)<strong>CoBank</strong> 2011 <strong>Annual</strong> <strong>Report</strong>49
Our net interest income is lower in the rising interest ratescenarios due to our liability-sensitive position. Our Boardlimits the amount of adverse change to net interest income andmarket value of equity under a 200 basis point rate shock. Thelimit for market value of equity was 15 percent and the limitfor net interest income was 10 percent for all three yearspresented. At December 31, 2011, 2010 and 2009, we werewithin our policy limits as detailed in the table above.ForecastingWe update our asset/liability model monthly withinformation on loans, investment securities, borrowings andderivatives. This “current position” is the starting point for allanalysis. The current position data is then combined with basecase business plan assumptions and independent, third-partyeconomic forecasts to derive our estimates of future netinterest income. Generally, we set assumptions on pricing,maturity characteristics and funding mix using trend analysisof actual asset and liability data.Net interest income forecasts are derived utilizingdifferent interest rate scenarios. As noted previously, weobtain independent market interest rate projections whenpreparing our forecasts. These interest rate projections aredesigned around economic forecasts that are meant to estimatethe most likely path of interest rates for the planning horizonand alternate views of a rapidly expanding economy, and adramatically slowing economy. In addition, we reviewscenarios based on the market’s implied forward rates andunchanged rates. We also review the impact on net interestincome of parallel and nonparallel shifts in the yield curveover different time horizons using stochastic processes, orthose involving a randomly determined sequence ofobservations.Use of DerivativesWe use derivatives as an integral part of our interest raterisk management activities. To achieve risk managementobjectives and satisfy the financing needs of our borrowers,we execute various derivative transactions with other financialinstitutions. Derivatives (primarily interest rate swaps) areused to manage liquidity and the interest rate risk arising frommaturity and repricing mismatches between assets andliabilities. In addition, we execute foreign exchange spot andforward contracts to manage currency risk on our relativelynominal amount of loans denominated in foreign currencies.The notional amounts of derivatives, weighted average interestrates to be received and paid, and fair values at December 31,2011, are shown in the following table. We also discussderivatives in Note 11 to the accompanying consolidatedfinancial statements.Derivative Financial Instruments atDecember 31, 2011 ($ in Millions)Derivative ProductNotionalAmountWeightedAverageReceiveRateWeightedAveragePayRateFairValueReceive Fixed Swaps $ 19,230 2.57 % 0.32 % $ 956Receive FixedAmortizing Swaps1,031 2.86 0.51 78Pay Fixed Swaps 1,963 0.55 1.80 (62)Pay FixedAmortizing Swaps1,031 0.51 2.64 (66)Interest Rate Options 1,999 - - 2Foreign CurrencySpots and Forwards299 - - 4Total $ 25,553 2.32 % 0.55 % $ 912We have included a summary of our derivatives portfolioby strategy with further explanation of each strategy in thefollowing section.Notional Amounts of DerivativeFinancial Instruments by Strategy ($ in Millions)December 31,2011 2010 2009Liquidity Management $ 14,364 $ 21,474 $ 24,325Equity Positioning 2,903 3,088 2,928Options Risk Management (1) 1,850 1,850 1,500Customer Transactions 6,193 4,411 3,685Foreign Currency RiskManagement (2) 243 131 128Total $ 25,553 $ 30,954 $ 32,566(1) Excludes $149.0 million, $206.0 million and $100.0 million of interestrate options at December 31, 2011, 2010 and 2009, respectively, whichare classified as customer transactions.(2) Excludes $56.0 million, $68.0 million and $90.0 million of foreign currency spotsand forwards at December 31, 2011, 2010 and 2009, respectively, whichare classified as customer transactions.The total notional amount of our derivatives portfoliodecreased by $5.4 billion in 2011. The decrease was largelydue to a lower level of liquidity management derivatives, as aportion of our liquidity objectives were met through theincrease of floating-rate term debt instead of the use ofderivatives that convert fixed-rate term debt to floating-rate.This was partially offset by a higher level of customerderivative activity in 2011, as customers took advantage of thelow rate environment to lock-in or protect their term fundingcosts.<strong>CoBank</strong> 2011 <strong>Annual</strong> <strong>Report</strong>50
- Page 4 and 5: Everett DobrinskiChairmanRobert B.
- Page 6 and 7: “ We firmly believe the combined
- Page 8 and 9: associations are partnering with Co
- Page 11 and 12: 2012 BOARD OF DIRECTORSOccupation:F
- Page 13 and 14: “WE ARE COMMITTEDTO GOOD GOVERNAN
- Page 15 and 16: U.S. AgBank CEO Darryl Rhodes (fron
- Page 17 and 18: KansasNew MexicoUtahFC of Ness City
- Page 19 and 20: CorporateCitizenshipAT COBANKSuppor
- Page 21 and 22: StrategicRelationshipsFarm Credit o
- Page 23 and 24: RegionalAgribusinessBANKING GROUPCe
- Page 25 and 26: CorporateAgribusinessBANKING GROUPK
- Page 27 and 28: ElectricDistributionBANKING DIVISIO
- Page 29 and 30: Power SupplyBANKING DIVISIONTri-Sta
- Page 31 and 32: IndustryPortfoliosCoBank ended 2011
- Page 33 and 34: CoBank is a financially strong,depe
- Page 35 and 36: 30COBANK 2011ANNUAL REPORTbuilding
- Page 37 and 38: The information and disclosures con
- Page 39 and 40: Financial Condition andResults of O
- Page 41 and 42: Provision for Loan Losses and Reser
- Page 43 and 44: Purchased services expense decrease
- Page 45 and 46: AgribusinessOverviewThe Agribusines
- Page 47 and 48: Rural InfrastructureOverviewThe Rur
- Page 49 and 50: Credit ApprovalThe most critical el
- Page 51 and 52: Total nonaccrual loans were $134.9
- Page 53: Basis RiskBasis risk arises due to
- Page 57 and 58: The notional amount of our derivati
- Page 59 and 60: Reputation Risk ManagementReputatio
- Page 61 and 62: Investment Securities ($ in Million
- Page 63 and 64: In accordance with the Farm Credit
- Page 65 and 66: Critical Accounting EstimatesManage
- Page 67 and 68: Business OutlookWe closed our merge
- Page 69 and 70: Consolidated Income StatementsCoBan
- Page 71 and 72: Consolidated Statements of Cash Flo
- Page 73 and 74: Consolidated Statements of Changes
- Page 75 and 76: LoansWe report loans, excluding lea
- Page 77 and 78: If we determine that a derivative n
- Page 79 and 80: Reserve for Credit ExposureThe foll
- Page 81 and 82: The information in the tables under
- Page 83 and 84: The following tables present inform
- Page 85 and 86: At December 31, 2011, gross minimum
- Page 87 and 88: For impaired investment securities,
- Page 89 and 90: At December 31, 2011, the assets of
- Page 91 and 92: Preferred StockThe following table
- Page 93 and 94: The following table provides a summ
- Page 95 and 96: AssumptionsWe measure plan obligati
- Page 97 and 98: Incentive Compensation PlansWe have
- Page 99 and 100: Note 11 - Derivative FinancialInstr
- Page 101 and 102: A summary of the impact of derivati
- Page 103 and 104: Due to the uncertainty of expected
- Page 105 and 106:
Assets and Liabilities Measured atF
- Page 107 and 108:
Note 14 - Segment Financial Informa
- Page 109 and 110:
Note 15 - Commitments and Contingen
- Page 111 and 112:
Note 18 - Subsequent Events (Unaudi
- Page 113 and 114:
Supplemental District Financial Inf
- Page 115 and 116:
Supplemental District Financial Inf
- Page 117 and 118:
Report of Independent AuditorsCoBan
- Page 119 and 120:
Management’s Report on Internal C
- Page 121 and 122:
Annual Report to Shareholders Discl
- Page 123 and 124:
Board of Directors Disclosure as of
- Page 125 and 126:
Board of Directors Disclosure as of
- Page 127 and 128:
Board of Directors Disclosure as of
- Page 129 and 130:
Board of Directors Disclosure as of
- Page 131 and 132:
Senior OfficersCoBank, ACBRobert B.
- Page 133 and 134:
Senior Officers Compensation Discus
- Page 135 and 136:
Senior Officers Compensation Discus
- Page 137 and 138:
Senior Officers Compensation Discus
- Page 139 and 140:
Senior Officers Compensation Discus
- Page 141 and 142:
Senior Officers Compensation Discus
- Page 143 and 144:
Senior Officers Compensation Discus
- Page 145 and 146:
Code of EthicsCoBank, ACBCoBank set
- Page 147 and 148:
CERTIFICATIONI, Robert B. Engel, Pr
- Page 149 and 150:
LeadershipCoBank, ACBRobert B. Enge
- Page 151 and 152:
OfficeLocationsCoBank National Offi


