- Page 3 and 4:
Your comments on the format and con
- Page 5 and 6:
During the course of this project,
- Page 7 and 8:
AcknowledgmentsThese Guidelines rep
- Page 9 and 10:
FundingFunding of this project was
- Page 11 and 12:
Table of ContentsBook 1SubjectPage
- Page 13 and 14:
1. Introduction1.1 GeneralGood asse
- Page 15 and 16:
(iv) provide proven practice approa
- Page 17 and 18:
3. Research Procedure3.1 Terms of R
- Page 19 and 20:
4. How to use these Guidelines4.1 W
- Page 21 and 22:
6. Units of MeasurementQuantity Uni
- Page 23 and 24:
8. Earthen Irrigation Channels8.1 D
- Page 25 and 26:
8.3 ReferencesAustralian National C
- Page 27 and 28:
9.1 IntroductionA key input to adva
- Page 29 and 30:
Data from Goulburn-Murray Water’s
- Page 31 and 32:
General 1 2 3 4 5 6DescriptionRisk
- Page 33 and 34:
Channel BankSequential Deterioratio
- Page 35 and 36:
9.2 ReferencesGutteridge Haskins &
- Page 37 and 38:
10.2.3.1 Dispersive layer of materi
- Page 39 and 40:
Causes ofSpecific factorDeteriorati
- Page 41 and 42:
10.1.2.5 BendsA bend in the channel
- Page 43 and 44:
10.1.4.1 Construction techniqueIrri
- Page 45 and 46:
10.1.5.4 Overtopping of banksIn ade
- Page 47 and 48:
In the past maintenance techniques
- Page 49 and 50:
Maintenance is a continuing require
- Page 51 and 52:
10.1.7.4 Yabbies/fresh water crayfi
- Page 54 and 55:
Direct removal ofmaterial by entrai
- Page 56 and 57:
Figure 10.10 shows longitudinal cra
- Page 58 and 59:
10.2.3.3 Irregular compaction - bri
- Page 60 and 61:
10.3 ReferencesEmerson W (1996), pe
- Page 62 and 63:
11.1 GeneralThe Investigation and P
- Page 64 and 65:
iv) Available fill materials and, w
- Page 66 and 67:
12.15 Radius of Bends .............
- Page 68 and 69:
There are several ways a channel ca
- Page 70 and 71:
• Land acquisition extent and typ
- Page 72 and 73:
The investigation should generally
- Page 74 and 75:
• Backfill: 10% compaction factor
- Page 76 and 77:
1. Flow Area, A, is the cross-secti
- Page 78 and 79:
after ageing and weed growth. If an
- Page 80 and 81:
elationships may be the controlling
- Page 82 and 83:
These maximum velocities should be
- Page 84 and 85:
Thus channels are usually designed
- Page 86 and 87:
Some of the design issues that shou
- Page 88 and 89:
12.12.1.3 Best PracticeEither of th
- Page 90 and 91:
12.13.2 Channel MaintenanceIncrease
- Page 92 and 93:
along a channel. The depth of the w
- Page 94 and 95:
12.13.4.7 Change of AlignmentThe in
- Page 96 and 97:
12.15 Radius of Bends12.15.1 Flow A
- Page 98 and 99:
12.16 Channel Cross SectionThe cros
- Page 100 and 101:
Some irrigation authorities use one
- Page 102 and 103:
12.16.2 BanksChannel cross sections
- Page 104 and 105:
Unless the bank is very high, the s
- Page 106 and 107:
The stability of channel batters ca
- Page 108 and 109:
drop bars become difficult and time
- Page 110 and 111:
Both the height above the bed and t
- Page 112 and 113:
• enable maintenance of the chann
- Page 114 and 115:
- Access agreementsA description of
- Page 116 and 117:
13/08/02 19:2012.20 Channel Tenure
- Page 118 and 119:
13/08/02 19:20As with the damage to
- Page 120 and 121:
13/08/02 19:20Advantages of Protect
- Page 122 and 123:
- gates provide a better deterrent
- Page 124 and 125:
13/08/02 19:20When considering expo
- Page 126 and 127:
13/08/02 19:20A typical design draw
- Page 128 and 129:
13/08/02 19:20Sinclair Knight Merz
- Page 130 and 131:
13.1 IntroductionIn many irrigation
- Page 132 and 133:
For example, the initial constructi
- Page 134 and 135:
13.2.6 When to use Life Cycle Analy
- Page 136 and 137:
The timing of the life-cycle costin
- Page 138 and 139:
• assess cost of collecting missi
- Page 140 and 141:
Microsoft Excel has quite a good pr
- Page 142 and 143:
The costs used in these methods sho
- Page 144 and 145:
Life CyclePhaseInvestigationDesignC
- Page 146 and 147:
Life CyclePhaseMaintenanceRehabilit
- Page 148 and 149:
ReplacementProject managementInvest
- Page 150 and 151:
Residual valueLegal feesInsuranceAd
- Page 152 and 153:
13.4.6.2 Recurring CostsChannel con
- Page 154 and 155:
$1.00.80Percent ofValue of$1.00.60.
- Page 156 and 157:
13.4.11 Evaluate ResultsThe results
- Page 158 and 159:
13.6 Tipsthe way open to incur sign
- Page 160 and 161:
14. Risk AnalysisTable of ContentsS
- Page 162 and 163:
Consequences for irrigation authori
- Page 164 and 165:
15. Material Selection and TestingT
- Page 166 and 167:
c) Shrinkage - will the bank crack
- Page 168 and 169:
depth. For this reason, the soils o
- Page 170 and 171:
Natural moisture content should als
- Page 172 and 173:
The study identified some confusion
- Page 174 and 175:
15.4.2 Determination of the plastic
- Page 176 and 177:
1. Preparation of PatTake approxima
- Page 178 and 179:
EmersonClass No.Degree ofDispersion
- Page 180 and 181:
15.7.1 Coarse grained soilsIn this
- Page 182 and 183:
sufficient gravel for erosion resis
- Page 184 and 185:
GroupSymbolsSuitability for Earthen
- Page 186 and 187:
The uniform application and thoroug
- Page 188 and 189:
essential that the chemical is thor
- Page 190 and 191:
Where laboratory testing facilities
- Page 192 and 193:
Clays are the plastic fines. They c
- Page 194 and 195:
etween the soil sample and the wate
- Page 196 and 197:
16. Compaction ControlTable of Cont
- Page 198 and 199:
16.1 PurposeDuring this research pr
- Page 200 and 201:
All compaction equipment utilises s
- Page 202 and 203:
The soil density required for a cha
- Page 204 and 205:
In the past, a method specification
- Page 206 and 207:
Low permeability and high stability
- Page 208 and 209:
16.10.1.1 Tamping Foot RollerTampin
- Page 210 and 211:
16.10.1.5 Non-Circular Impact Rolle
- Page 212 and 213:
16.10.3 Compactor OperationsAfter t
- Page 214 and 215:
16.11.4 Moisture Content ControlBef
- Page 216 and 217:
16.12 Density Control Tests and Pro
- Page 218 and 219:
Correlation with local materials an
- Page 220 and 221:
The main advantages of the Nuclear
- Page 222 and 223:
Figure 16.4Hilf Density Ratio Repor
- Page 224 and 225:
The location and test results for e
- Page 226 and 227:
16.14.3 Reporting and RecordsTest r
- Page 228 and 229:
16.16 Tests for small projectsThe s
- Page 230 and 231:
The advantages of the Drop Test are
- Page 232 and 233:
AS1289.6.3.2-1997AS1289.6.3.3-1997A
- Page 234 and 235:
17. Protective CoverTable of Conten
- Page 236 and 237:
The bank dries and cracks from the
- Page 238 and 239:
17.5 Specifications17.5.1 GravelPar
- Page 240 and 241:
17.6 Establish Vegetation CoverTops
- Page 242 and 243:
Species Growing Conditions Establis
- Page 244 and 245:
17.7.2 Rope Wick ApplicationMuch of
- Page 246 and 247:
There are a number of fibre mats or
- Page 248 and 249:
17.10 Australian StandardsAS1289.3.
- Page 250 and 251:
18.1 IntroductionFor many earthen c
- Page 252 and 253:
When re-shaping the batters of exis
- Page 254 and 255:
LifeCrestOld bank lineBattered bank
- Page 256 and 257:
Photos\inside batter\CG7channel2arm
- Page 258 and 259:
4. To help place the rock material
- Page 260 and 261:
False ToeFigure 18.8Protective laye
- Page 262 and 263:
The confinement system would be adv
- Page 264 and 265:
• Able to survive during non-oper
- Page 266 and 267:
18.6 ReferencesHutchison D & Locke
- Page 268 and 269:
19.20 Guidelines on Field Quality C
- Page 270 and 271:
Construction and Refurbishment of E
- Page 272 and 273:
• Figure 19.2)3. Temporary Bench
- Page 274 and 275:
The capabilities and limitations of
- Page 276 and 277:
19.3.1 Construction EquipmentThe ba
- Page 278 and 279:
construction. The aim of scarifying
- Page 280 and 281:
Whether or not a front-end loader o
- Page 282 and 283:
The thickness of each layer will va
- Page 284 and 285:
distribution. The use of alternativ
- Page 286 and 287:
19.8 Construction RecordsAdequate r
- Page 288 and 289:
19.12 Protective Cover on Crest and
- Page 290 and 291:
19.21 Australian StandardsAS 1726-1
- Page 292 and 293:
20.1 ScopeAustralia’s earthen irr
- Page 294 and 295:
Bank re-construction normally requi
- Page 296 and 297:
•meter outlet locations and type
- Page 298 and 299:
In the case of channel bank refurbi
- Page 300 and 301:
20.4.1.1 StrippingWith outside bank
- Page 302 and 303:
All public roads to be used by truc
- Page 304 and 305:
5. Material is delivered by trucks
- Page 306 and 307:
Need to drain and de-waterEBM befor
- Page 308 and 309:
significantly and a more conservati
- Page 310 and 311:
Aim for crest width ofabout 2 metre
- Page 312 and 313:
Refer to Section 18, Inside Batter
- Page 314 and 315: 21.8.10 Re-alignment ..............
- Page 316 and 317: Seepage is a complex hydrologic phe
- Page 318 and 319: 2. Seepage losses increase as the d
- Page 320 and 321: Refer also to the following section
- Page 322 and 323: 21.4 Channel Seepage ConsequencesSe
- Page 324 and 325: Channel seepage is one of the sever
- Page 326 and 327: Seepage is proportional to soil per
- Page 328 and 329: Methods based on vertical flow meas
- Page 330 and 331: ainfallPumpingevapotranspirationIrr
- Page 332 and 333: Flow NetsA flow net is a system of
- Page 334 and 335: Data from indirect measurement proc
- Page 336 and 337: (ii) EM SurveyElectro-magnetic (EM)
- Page 338 and 339: The volume of waterloss from the dr
- Page 340 and 341: 21.7.3.2 Inflow-Outflow Method (Dyn
- Page 342 and 343: Imperfect seal will cause the meter
- Page 344 and 345: The groundwater level can then be d
- Page 346 and 347: Stable IsotopesThe basis of testing
- Page 348 and 349: To be most successful, there needs
- Page 350 and 351: 21.8.6 Surface interception drainag
- Page 352 and 353: KeyWatertable before tree plantingW
- Page 354 and 355: • The preparation of a best pract
- Page 356 and 357: 21.11 ReferencesAustralian National
- Page 358 and 359: 22. Channel LiningTable of Contents
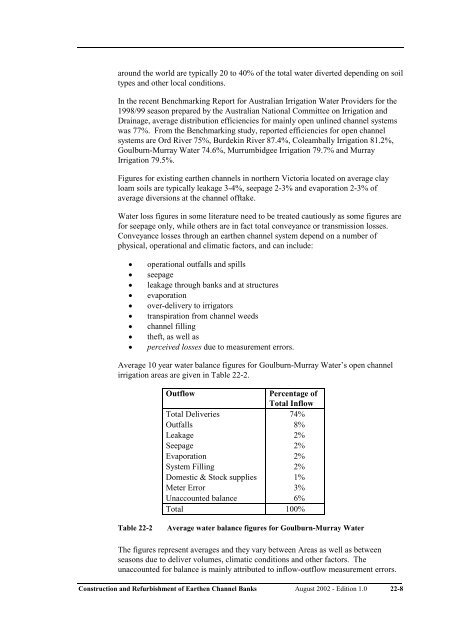
- Page 360 and 361: 22.1 IntroductionThe conservation o
- Page 362 and 363: The different types of channel lini
- Page 366 and 367: Lining of channels will not elimina
- Page 368 and 369: To supply a given discharge, the cr
- Page 370 and 371: 22.4.5 Structural SafetyThe stabili
- Page 372 and 373: soil pressures and under-drainage i
- Page 374 and 375: Concrete linings are suitable for b
- Page 376 and 377: 22.5.12 Availability of Constructio
- Page 378 and 379: esistance to erosion. To improve th
- Page 380 and 381: Construction and Refurbishment of E
- Page 382 and 383: 22.7.1.2 General Design Considerati
- Page 384 and 385: 22.7.1.4 Lining ThicknessThe thickn
- Page 386 and 387: particular problems, but in smaller
- Page 388 and 389: Where the earth lining finishes abo
- Page 390 and 391: control where the channel material
- Page 392 and 393: sand requires about 5% cement by we
- Page 394 and 395: 22.7.6 Soil SealantsSoil sealants a
- Page 396 and 397: 22.7.7 Cost of Earth LiningsThe cap
- Page 398 and 399: Although they can assist with shear
- Page 400 and 401: 22.8.2 Membrane Liner TypesGeomembr
- Page 402 and 403: Polyethylene has also appeared in m
- Page 404 and 405: FPP resistance to common chemical e
- Page 406 and 407: The base coat and seal coat rates m
- Page 408 and 409: A common and misleading argument is
- Page 410 and 411: These thermal expansion and contrac
- Page 412 and 413: Another factor is the ability to ha
- Page 414 and 415:
Some lining methods expand and cont
- Page 416 and 417:
22.8.9.1 Geomembrane ThicknessThe t
- Page 418 and 419:
Cover typeThickness ofEarth fill(m)
- Page 420 and 421:
22.8.9.5 Cover MaterialGeomembranes
- Page 422 and 423:
As well, velocities which are permi
- Page 424 and 425:
22.8.11 FencingWhen livestock, part
- Page 426 and 427:
22.10 ReferencesAlther GR (1987), T
- Page 428 and 429:
23. Measures to Reduce the Rate ofD
- Page 430 and 431:
Channel DesignBank MaterialDeterior
- Page 432 and 433:
Stock and VerminAdjacentlandholders
- Page 434 and 435:
To ensure that a channel bank has a
- Page 436 and 437:
Advantages of Draining• Allows fo
- Page 438 and 439:
To efficiently maintain a channel,
- Page 440 and 441:
Compared with other countries where
- Page 442 and 443:
23.4.7 LeaksTransverse cracks are t
- Page 444 and 445:
23.5 Reduction of Deterioration due
- Page 446 and 447:
Photo 23-1Channel bed showing mumbl
- Page 448 and 449:
Thus, control of carp by draining c
- Page 450 and 451:
The disadvantages of a biological c
- Page 452 and 453:
Carp have been blamed for erosion o
- Page 454 and 455:
Management Groups gives guidelines
- Page 456 and 457:
Organisation Contact Details Aims/A
- Page 458 and 459:
Chemical treatment is often recomme
- Page 460 and 461:
23.7 Reduction of Deterioration due
- Page 462 and 463:
Grey Parrot Pea - Dillaynia cineres
- Page 464 and 465:
Lodge G (1998), Review on Fish Barr
- Page 466 and 467:
cation exchange capacity (CEC) a me
- Page 468 and 469:
fetch the distance over which the w
- Page 470 and 471:
plant term used for construction eq
- Page 472:
supply level the supply level is a