Student Experiences of the Leaving Certificate Applied Programme
Student Experiences of the Leaving Certificate Applied Programme
Student Experiences of the Leaving Certificate Applied Programme
You also want an ePaper? Increase the reach of your titles
YUMPU automatically turns print PDFs into web optimized ePapers that Google loves.
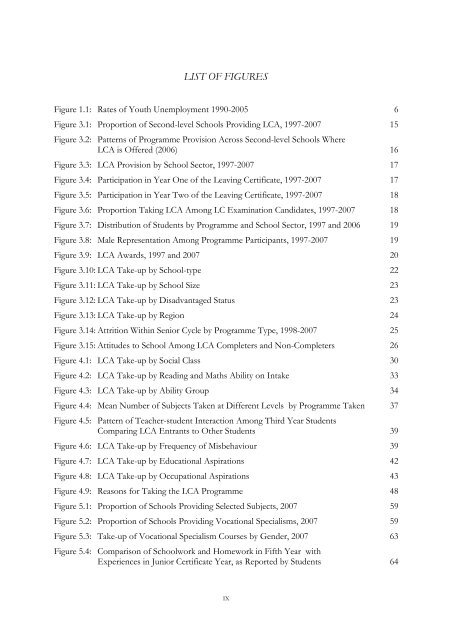
LIST OF FIGURESFigure 1.1: Rates <strong>of</strong> Youth Unemployment 1990-2005 6Figure 3.1: Proportion <strong>of</strong> Second-level Schools Providing LCA, 1997-2007 15Figure 3.2: Patterns <strong>of</strong> <strong>Programme</strong> Provision Across Second-level Schools WhereLCA is Offered (2006) 16Figure 3.3: LCA Provision by School Sector, 1997-2007 17Figure 3.4: Participation in Year One <strong>of</strong> <strong>the</strong> <strong>Leaving</strong> <strong>Certificate</strong>, 1997-2007 17Figure 3.5: Participation in Year Two <strong>of</strong> <strong>the</strong> <strong>Leaving</strong> <strong>Certificate</strong>, 1997-2007 18Figure 3.6: Proportion Taking LCA Among LC Examination Candidates, 1997-2007 18Figure 3.7: Distribution <strong>of</strong> <strong>Student</strong>s by <strong>Programme</strong> and School Sector, 1997 and 2006 19Figure 3.8: Male Representation Among <strong>Programme</strong> Participants, 1997-2007 19Figure 3.9: LCA Awards, 1997 and 2007 20Figure 3.10: LCA Take-up by School-type 22Figure 3.11: LCA Take-up by School Size 23Figure 3.12: LCA Take-up by Disadvantaged Status 23Figure 3.13: LCA Take-up by Region 24Figure 3.14: Attrition Within Senior Cycle by <strong>Programme</strong> Type, 1998-2007 25Figure 3.15: Attitudes to School Among LCA Completers and Non-Completers 26Figure 4.1: LCA Take-up by Social Class 30Figure 4.2: LCA Take-up by Reading and Maths Ability on Intake 33Figure 4.3: LCA Take-up by Ability Group 34Figure 4.4: Mean Number <strong>of</strong> Subjects Taken at Different Levels by <strong>Programme</strong> Taken 37Figure 4.5: Pattern <strong>of</strong> Teacher-student Interaction Among Third Year <strong>Student</strong>sComparing LCA Entrants to O<strong>the</strong>r <strong>Student</strong>s 39Figure 4.6: LCA Take-up by Frequency <strong>of</strong> Misbehaviour 39Figure 4.7: LCA Take-up by Educational Aspirations 42Figure 4.8: LCA Take-up by Occupational Aspirations 43Figure 4.9: Reasons for Taking <strong>the</strong> LCA <strong>Programme</strong> 48Figure 5.1: Proportion <strong>of</strong> Schools Providing Selected Subjects, 2007 59Figure 5.2: Proportion <strong>of</strong> Schools Providing Vocational Specialisms, 2007 59Figure 5.3: Take-up <strong>of</strong> Vocational Specialism Courses by Gender, 2007 63Figure 5.4: Comparison <strong>of</strong> Schoolwork and Homework in Fifth Year with<strong>Experiences</strong> in Junior <strong>Certificate</strong> Year, as Reported by <strong>Student</strong>s 64IX


