36 ENGAGING YOUNG PEOPLE?more realistic about <strong>the</strong>ir ability to cope with schoolwork at second-level(Smyth, Darmody and McCoy, 2004, p. 243). Respondents reflected how itwas during <strong>the</strong> transition from first to second year that <strong>the</strong>y began tostruggle with <strong>the</strong>ir schoolwork and experience behavioural problems. Thiswas particularly evident for respondents who subsequently dropped out <strong>of</strong>LCA. Some commented on <strong>the</strong> increased pace <strong>of</strong> instruction and workloadand o<strong>the</strong>rs referred to changes in <strong>the</strong>ir peer group which <strong>of</strong>ten resultedfrom re-streaming <strong>of</strong> classes in second year. Roy, who dropped out <strong>of</strong> LCAin fifth year, began to struggle specifically with Maths at <strong>the</strong> end <strong>of</strong> firstyear:They started doing algebra and something like that and that’s too hard andTechnical Graphics, I couldn’t do that at all. (Roy, 22, dropped out <strong>of</strong>LCA, unemployed)During his first year, Garry found his school work was manageable butbegan to experience difficulties at <strong>the</strong> beginning <strong>of</strong> second year. It was atthis point that he began to recognise his preference for practical subjects:It kind <strong>of</strong> changed again, like <strong>the</strong> work itself was getting harder in second yearlike, I found <strong>the</strong> subjects, I was kind <strong>of</strong> falling behind in. Science was really hard,what else, I liked Metalwork and Woodwork. (Garry, 22, dropped out <strong>of</strong>LCA, employed)In some cases respondents’ academic difficulties coincided with classesbeing re-streamed at <strong>the</strong> beginning <strong>of</strong> second year. Zoe had liked secondlevelschool in first year but found schoolwork much harder in second year.Separated from her friends she found <strong>the</strong> reshuffle <strong>of</strong> different classesdisruptive:The start <strong>of</strong> it was alright but <strong>the</strong>n I just started to hate it…it just started gettingtoo hard and I was like, you know, I don’t like this….Everything startedchanging again, you know, new people were coming into <strong>the</strong> class, people weregetting moved up and down. (Zoe, 22, dropped out <strong>of</strong> LCA, unemployed)In relation to homework, longitudinal data show that those who wenton to LCA had generally spent less time on it than o<strong>the</strong>r students (56 v. 89minutes at <strong>the</strong> beginning <strong>of</strong> first year, 57 v. 86 minutes at <strong>the</strong> end <strong>of</strong> firstyear, and 70 v. 114 minutes in third year). Interestingly, this pattern doesnot apply within second year (85 v. 92 minutes), perhaps reflecting apattern <strong>of</strong> ‘drift’ more generally among this cohort.One interviewee felt she did <strong>the</strong> bare minimum <strong>of</strong> homework in orderto get through classes in junior cycle. When asked about homework injunior cycle, Fiona recalled how one hour’s work would take her tenminutes:I’d do it like, I’d do it for <strong>the</strong> sake <strong>of</strong> doing it, so I’d go home like, it’d just belike, it wouldn’t be a struggle like because I’d just do it within ten minutes. Itwas supposed to take an hour and a half but I’d be doing it in ten minutes and<strong>the</strong>n I could just go out like. (Fiona, 25, completed LCA, employed)The longitudinal study also shows that students who received learningsupport in third year were much more likely to go on to take LCA than
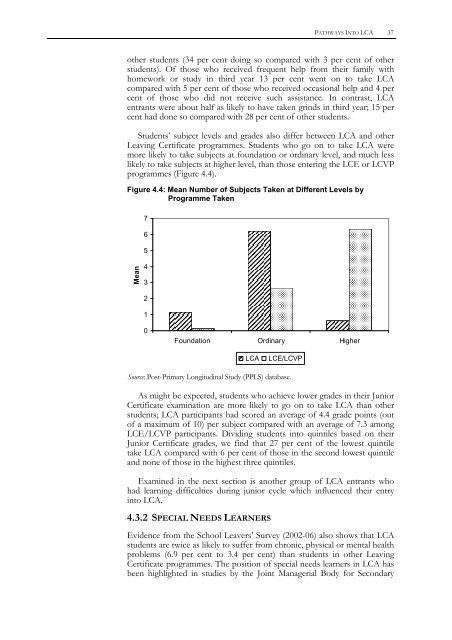
PATHWAYS INTO LCA 37o<strong>the</strong>r students (34 per cent doing so compared with 3 per cent <strong>of</strong> o<strong>the</strong>rstudents). Of those who received frequent help from <strong>the</strong>ir family withhomework or study in third year 13 per cent went on to take LCAcompared with 5 per cent <strong>of</strong> those who received occasional help and 4 percent <strong>of</strong> those who did not receive such assistance. In contrast, LCAentrants were about half as likely to have taken grinds in third year; 15 percent had done so compared with 28 per cent <strong>of</strong> o<strong>the</strong>r students.<strong>Student</strong>s’ subject levels and grades also differ between LCA and o<strong>the</strong>r<strong>Leaving</strong> <strong>Certificate</strong> programmes. <strong>Student</strong>s who go on to take LCA weremore likely to take subjects at foundation or ordinary level, and much lesslikely to take subjects at higher level, than those entering <strong>the</strong> LCE or LCVPprogrammes (Figure 4.4).Figure 4.4: Mean Number <strong>of</strong> Subjects Taken at Different Levels by<strong>Programme</strong> TakenMean76543210FoundationOrdinaryHigherLCALCE/LCVPSource: Post-Primary Longitudinal Study (PPLS) database.As might be expected, students who achieve lower grades in <strong>the</strong>ir Junior<strong>Certificate</strong> examination are more likely to go on to take LCA than o<strong>the</strong>rstudents; LCA participants had scored an average <strong>of</strong> 4.4 grade points (out<strong>of</strong> a maximum <strong>of</strong> 10) per subject compared with an average <strong>of</strong> 7.3 amongLCE/LCVP participants. Dividing students into quintiles based on <strong>the</strong>irJunior <strong>Certificate</strong> grades, we find that 27 per cent <strong>of</strong> <strong>the</strong> lowest quintiletake LCA compared with 6 per cent <strong>of</strong> those in <strong>the</strong> second lowest quintileand none <strong>of</strong> those in <strong>the</strong> highest three quintiles.Examined in <strong>the</strong> next section is ano<strong>the</strong>r group <strong>of</strong> LCA entrants whohad learning difficulties during junior cycle which influenced <strong>the</strong>ir entryinto LCA.4.3.2 SPECIAL NEEDS LEARNERSEvidence from <strong>the</strong> School Leavers’ Survey (2002-06) also shows that LCAstudents are twice as likely to suffer from chronic, physical or mental healthproblems (6.9 per cent to 3.4 per cent) than students in o<strong>the</strong>r <strong>Leaving</strong><strong>Certificate</strong> programmes. The position <strong>of</strong> special needs learners in LCA hasbeen highlighted in studies by <strong>the</strong> Joint Managerial Body for Secondary


