

Student Experiences of the Leaving Certificate Applied Programme
Student Experiences of the Leaving Certificate Applied Programme
Student Experiences of the Leaving Certificate Applied Programme

Create successful ePaper yourself
Turn your PDF publications into a flip-book with our unique Google optimized e-Paper software.
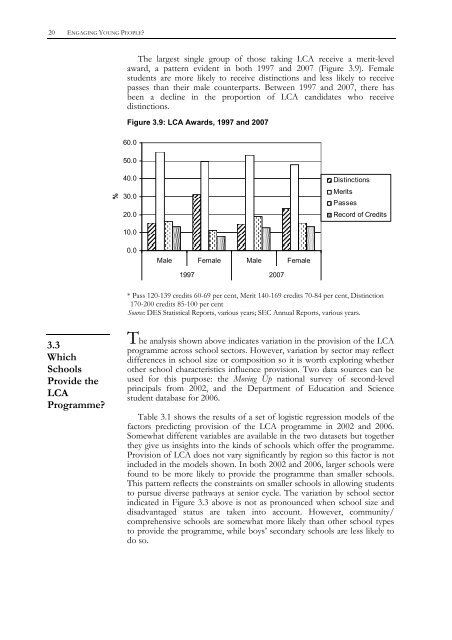
20 ENGAGING YOUNG PEOPLE?The largest single group <strong>of</strong> those taking LCA receive a merit-levelaward, a pattern evident in both 1997 and 2007 (Figure 3.9). Femalestudents are more likely to receive distinctions and less likely to receivepasses than <strong>the</strong>ir male counterparts. Between 1997 and 2007, <strong>the</strong>re hasbeen a decline in <strong>the</strong> proportion <strong>of</strong> LCA candidates who receivedistinctions.Figure 3.9: LCA Awards, 1997 and 200760.050.0%40.030.020.0DistinctionsMeritsPassesRecord <strong>of</strong> Credits10.00.0Male Female Male Female1997 2007* Pass 120-139 credits 60-69 per cent, Merit 140-169 credits 70-84 per cent, Distinction170-200 credits 85-100 per centSource: DES Statistical Reports, various years; SEC Annual Reports, various years.3.3WhichSchoolsProvide <strong>the</strong>LCA<strong>Programme</strong>?The analysis shown above indicates variation in <strong>the</strong> provision <strong>of</strong> <strong>the</strong> LCAprogramme across school sectors. However, variation by sector may reflectdifferences in school size or composition so it is worth exploring whe<strong>the</strong>ro<strong>the</strong>r school characteristics influence provision. Two data sources can beused for this purpose: <strong>the</strong> Moving Up national survey <strong>of</strong> second-levelprincipals from 2002, and <strong>the</strong> Department <strong>of</strong> Education and Sciencestudent database for 2006.Table 3.1 shows <strong>the</strong> results <strong>of</strong> a set <strong>of</strong> logistic regression models <strong>of</strong> <strong>the</strong>factors predicting provision <strong>of</strong> <strong>the</strong> LCA programme in 2002 and 2006.Somewhat different variables are available in <strong>the</strong> two datasets but toge<strong>the</strong>r<strong>the</strong>y give us insights into <strong>the</strong> kinds <strong>of</strong> schools which <strong>of</strong>fer <strong>the</strong> programme.Provision <strong>of</strong> LCA does not vary significantly by region so this factor is notincluded in <strong>the</strong> models shown. In both 2002 and 2006, larger schools werefound to be more likely to provide <strong>the</strong> programme than smaller schools.This pattern reflects <strong>the</strong> constraints on smaller schools in allowing studentsto pursue diverse pathways at senior cycle. The variation by school sectorindicated in Figure 3.3 above is not as pronounced when school size anddisadvantaged status are taken into account. However, community/comprehensive schools are somewhat more likely than o<strong>the</strong>r school typesto provide <strong>the</strong> programme, while boys’ secondary schools are less likely todo so.


