- Page 2:
Tammy FoxRed Hat ®Enterprise Linux
- Page 6:
Contents at a GlanceIntroduction ..
- Page 10:
Table of ContentsIntroduction 1Part
- Page 14:
ContentsviiConfiguring the Runlevel
- Page 18:
ContentsixHow It All Works.........
- Page 22:
ContentsxiLogging Samba Connections
- Page 26:
ContentsxiiiPart V Monitoring and T
- Page 30:
ContentsxvStarting and Stopping the
- Page 34:
About the AuthorTammy Fox has been
- Page 38:
We Want to Hear from You!As the rea
- Page 42:
IntroductionSo you’ve decided to
- Page 46:
Introduction 3Part III: System Admi
- Page 50:
Introduction 5Feedback and Correcti
- Page 54:
PART IInstallation andConfiguration
- Page 58:
CHAPTER 1Installing Red HatEnterpri
- Page 62:
Creating the Installation Source 11
- Page 66:
Creating the Installation Source 13
- Page 70:
Starting the Installation 15Startin
- Page 74:
Performing the Installation 17If Ha
- Page 78:
Performing the Installation 19A boo
- Page 82:
Performing the Installation 21As a
- Page 86:
Performing the Installation 23NOTEA
- Page 90:
Performing the Installation 256. Op
- Page 94:
Performing the Installation 274. Cr
- Page 98:
Performing the Installation 291FIGU
- Page 102:
Installing with Kickstart 31Creatin
- Page 106:
Installing with Kickstart 33Basic S
- Page 110:
Installing with Kickstart 35--bootp
- Page 114:
Installing with Kickstart 37--initl
- Page 118:
Installing with Kickstart 39--maxsi
- Page 122:
Installing with Kickstart 41. zfcpO
- Page 126:
Installing with Kickstart 43. reboo
- Page 130:
Installing with Kickstart 45--drive
- Page 134:
Installing with Kickstart 47Use a s
- Page 138:
Installing with Kickstart 49Use thi
- Page 142:
Installing with Kickstart 51. NFS s
- Page 146:
Installing with PXE 53Now, you shou
- Page 150:
Performing an Upgrade 55Configuring
- Page 154:
CHAPTER 2Post-InstallationConfigura
- Page 158:
Red Hat Setup Agent 592FIGURE 2.2En
- Page 162:
Red Hat Setup Agent 612FIGURE 2.5Se
- Page 166:
Red Hat Setup Agent 63After you hav
- Page 170:
Network Configuration 652FIGURE 2.1
- Page 174:
Network Configuration 67The /etc/ho
- Page 178:
Printer Configuration 69CAUTIONIf a
- Page 182:
Printer Configuration 712FIGURE 2.1
- Page 186:
Printer Configuration 732FIGURE 2.1
- Page 190:
Printer Configuration 75If the prin
- Page 194:
Adding Boot Parameters 77LISTING 2.
- Page 198:
CHAPTER 3Operating SystemUpdatesThi
- Page 202:
Assigning Users for the RHN Website
- Page 206:
Using System Groups on the RHN Webs
- Page 210:
Retrieving Software from RHN with Y
- Page 214:
Retrieving Software from RHN with Y
- Page 218:
Retrieving Software from RHN with Y
- Page 222:
Retrieving Software from RHN with Y
- Page 226:
Retrieving Software from RHN with Y
- Page 230:
Summary 95CAUTIONAlthough the -y op
- Page 234:
PART IIOperating System CoreConcept
- Page 238:
CHAPTER 4Understanding LinuxConcept
- Page 242:
Learning the Desktop 1014FIGURE 4.1
- Page 246:
Shell Basics 103TABLE 4.1Continued/
- Page 250:
Shell Basics 105To remove a directo
- Page 254:
Shell Basics 107every command you h
- Page 258:
Shell Basics 109Reading Text FilesS
- Page 262:
Manual Pages 111Manual PagesOne gre
- Page 266:
Editing Text Files 113Vi EditorThe
- Page 270:
Editing Text Files 115A text versio
- Page 274:
File Permissions 117As you can prob
- Page 278:
Initialization Scripts 1194FIGURE 4
- Page 282:
Runlevels 121The default runlevel i
- Page 286:
Summary 123FIGURE 4.12ntsysv4Summar
- Page 290:
CHAPTER 5Working with RPMSoftwareA
- Page 294:
Installing Software 127Finding the
- Page 298:
Installing Software 129After verify
- Page 302:
Updating Software 131perform as wel
- Page 306:
Verifying Software Files 133package
- Page 310:
Building RPM Packages 135example, i
- Page 314:
Building RPM Packages 137such as yo
- Page 318:
Building RPM Packages139LISTING 5.9
- Page 322:
Building RPM Packages 141%filesThe
- Page 326:
Building RPM Packages 143Creating t
- Page 330:
Building RPM Packages 145LISTING 5.
- Page 334:
Building RPM Packages 147You are pr
- Page 338:
Summary 149When installing the exam
- Page 342:
CHAPTER 6Analyzing HardwareSimilar
- Page 346:
Listing Devices 153LISTING 6.1Conti
- Page 350:
Listing Devices 155LISTING 6.5Verbo
- Page 354:
Detecting Hardware157LISTING 6.7Con
- Page 358:
Gathering Information from the BIOS
- Page 362:
Gathering Information from the BIOS
- Page 366:
Listing and Configuring Kernel Modu
- Page 370:
HAL 165HALIf the kernel knows about
- Page 374:
CHAPTER 7Managing StorageManaging s
- Page 378:
Understanding Partitioning 169Creat
- Page 382:
Understanding LVM 171such as:mount
- Page 386:
Understanding LVM 173To increase th
- Page 390:
Understanding LVM 175Use the lvcrea
- Page 394:
Understanding LVM 177the final numb
- Page 398:
Understanding RAID 179If a snapshot
- Page 402:
Understanding RAID 181LISTING 7.7Cr
- Page 406:
Understanding RAID 183Device Size :
- Page 410:
Using Access Control Lists 185Under
- Page 414:
Using Access Control Lists 187. For
- Page 418:
Using Disk Quotas 189Removing ACLsT
- Page 422:
Using Disk Quotas 191If it is unabl
- Page 426:
Summary 193This grace period is use
- Page 430:
CHAPTER 864-Bit, Multi-Core, andHyp
- Page 434:
Multi-Core Processors 197Duplicate
- Page 438:
Multi-Core Processors 199LISTING 8.
- Page 442:
Processors with Hyper-Threading Tec
- Page 446:
PART IIISystem AdministrationIN THI
- Page 450:
CHAPTER 9Managing Users andGroupsIN
- Page 454:
Managing Users 207FIGURE 9.1List of
- Page 458:
Managing Users 209TABLE 9.1Options
- Page 462:
Managing Groups 211TABLE 9.3 Contin
- Page 466:
Managing Groups 213Deleting GroupsT
- Page 470:
How It All Works 215If shadow passw
- Page 474:
Best Practices 217Managing Username
- Page 478:
Summary 219If your company is quite
- Page 482:
CHAPTER 10Techniques for Backupand
- Page 486:
Using Amanda for Backups 223. Do mu
- Page 490:
Using Amanda for Backups 225Table 1
- Page 494:
Using Amanda for Backups 227Setting
- Page 498:
Using Amanda for Backups229TABLE 10
- Page 502:
Using Amanda for Backups 231As you
- Page 506:
Other Linux Backup Utilities 233com
- Page 510:
Recovery and Repair 235Rescue ModeR
- Page 514:
Recovery and Repair 237Once in sing
- Page 518:
CHAPTER 11Automating Taskswith Scri
- Page 522:
Writing Scripts with Bash 241TIPThe
- Page 526:
Writing Scripts with Bash 243TABLE
- Page 530:
Writing Scripts with Bash 245TABLE
- Page 534:
Additional Scripting Languages 247T
- Page 538:
Scheduling Tasks with Cron 249LISTI
- Page 542:
Scheduling Tasks with Cron 251The f
- Page 546:
PART IVNetwork ServicesIN THIS PART
- Page 550:
CHAPTER 12Identity ManagementManagi
- Page 554:
Enabling NIS 257. optional: Results
- Page 558:
Enabling NIS 259TIPLog messages for
- Page 562:
Enabling NIS 261/var/yp/nicknames f
- Page 566:
Enabling NIS 263To accept requests
- Page 570:
Enabling NIS 265Because the lines t
- Page 574:
Enabling LDAP 267Level and Firewall
- Page 578:
Enabling LDAP 269LISTING 12.3Contin
- Page 582:
Enabling LDAP 271LISTING 12.6Contin
- Page 586:
Enabling LDAP 273LISTING 12.7Modify
- Page 590:
Enabling LDAP 275LISTING 12.8Defaul
- Page 594:
Enabling LDAP 277Many applications
- Page 598:
Enabling Kerberos 279Configuring th
- Page 602:
Enabling Kerberos 281Principals mus
- Page 606:
Enabling Kerberos 283In the ACL fil
- Page 610:
Enabling SMB or Winbind Authenticat
- Page 614:
Enabling with Authentication Tool 2
- Page 618:
Enabling with Authentication Tool 2
- Page 622:
Enabling with Authentication Tool 2
- Page 626:
CHAPTER 13Network File SharingIN TH
- Page 630:
Network File System 295The SELinux
- Page 634:
Network File System 297On the Basic
- Page 638:
Network File System 299Editing and
- Page 642:
Network File System 301FIGURE 13.4A
- Page 646:
Network File System 303update the c
- Page 650:
Samba File Sharing 305To verify tha
- Page 654:
Samba File Sharing 307FIGURE 13.6Sa
- Page 658:
Samba File Sharing 309Clicking OK s
- Page 662:
Samba File Sharing 311If users will
- Page 666:
Samba File Sharing 313LISTING 13.6C
- Page 670:
Samba File Sharing 315If you know t
- Page 674:
Samba File Sharing 317TABLE 13.2Con
- Page 678:
CHAPTER 14Granting NetworkConnectiv
- Page 682:
Configuring the Server 321Chapter 3
- Page 686:
Configuring the Server 323LISTING 1
- Page 690:
Summary 325This argument is useful
- Page 694:
CHAPTER 15Creating a Web Serverwith
- Page 698:
Configuring the Server 329FIGURE 15
- Page 702:
Configuring the Server 331ListenSec
- Page 706:
Configuring the Server 333where is
- Page 710:
Configuring the Server 335virtual h
- Page 714:
Summary 337Starting and Stopping th
- Page 718:
CHAPTER 16Hostname Resolutionwith B
- Page 722:
Configuring BIND 341Install the bin
- Page 726:
Configuring BIND 343. masters: List
- Page 730:
Configuring BIND 345Configuring Vie
- Page 734:
Configuring BIND 347The default-por
- Page 738:
Configuring BIND Graphically 349Sta
- Page 742:
Logging Connections 351FIGURE 16.2I
- Page 746:
Logging Connections 353Only the fil
- Page 750:
CHAPTER 17Securing Remote Loginswit
- Page 754:
Configuring the Server 357key. If a
- Page 758:
Connecting from the Client 359If th
- Page 762:
Connecting from the Client 361It is
- Page 766:
Connecting from the Client 363Remem
- Page 770:
Connecting from the Client 365After
- Page 774:
CHAPTER 18Setting Up an EmailServer
- Page 778:
Understanding Email Concepts 369Sen
- Page 782:
Configuring Sendmail 371. local-hos
- Page 786:
Configuring Sendmail 373LISTING 18.
- Page 790:
Using POP and IMAP 375By default, t
- Page 794:
Allowing Email Connections 377LISTI
- Page 798:
CHAPTER 19Explaining OtherCommon Ne
- Page 802:
The xinetd Super Server 381LISTING
- Page 806:
The xinetd Super Server 383LISTING
- Page 810: The xinetd Super Server 385. A patt
- Page 814: Transferring Files with FTP 387. pe
- Page 818: Transferring Files with FTP 389TABL
- Page 822: Transferring Files with FTP 391TABL
- Page 826: Transferring Files with FTP 393To d
- Page 830: Keeping Accurate Time with NTP 395K
- Page 834: Keeping Accurate Time with NTP 397A
- Page 838: Creating a Network Printer with CUP
- Page 842: PART VMonitoring and TuningIN THIS
- Page 846: CHAPTER 20Monitoring SystemResource
- Page 850: Reporting Filesystem Usage 405To vi
- Page 854: Reporting Disk Performance 407TIPNa
- Page 858: Reporting Disk Performance 409/usr/
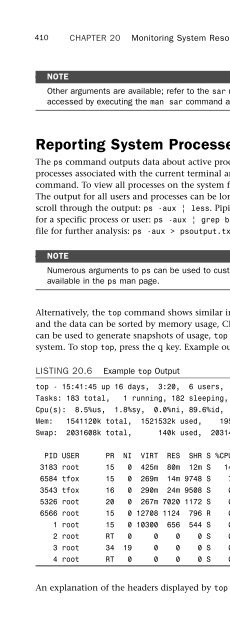
- Page 864: 412CHAPTER 20Monitoring System Reso
- Page 868: 414CHAPTER 20Monitoring System Reso
- Page 872: 416CHAPTER 20Monitoring System Reso
- Page 876: 418CHAPTER 20Monitoring System Reso
- Page 880: 420CHAPTER 20Monitoring System Reso
- Page 884: 422CHAPTER 20Monitoring System Reso
- Page 888: 424CHAPTER 21Monitoring and Tuning
- Page 892: 426CHAPTER 21Monitoring and Tuning
- Page 896: 428CHAPTER 21Monitoring and Tuning
- Page 900: 430CHAPTER 21Monitoring and Tuning
- Page 904: 432CHAPTER 21Monitoring and Tuning
- Page 908: 434CHAPTER 21Monitoring and Tuning
- Page 912:
436CHAPTER 21Monitoring and Tuning
- Page 916:
438CHAPTER 21Monitoring and Tuning
- Page 920:
440CHAPTER 21Monitoring and Tuning
- Page 924:
442CHAPTER 21Monitoring and Tuning
- Page 928:
444CHAPTER 21Monitoring and Tuning
- Page 932:
446CHAPTER 21Monitoring and Tuning
- Page 936:
448CHAPTER 21Monitoring and Tuning
- Page 940:
450CHAPTER 22Monitoring and Tuning
- Page 944:
452CHAPTER 22Monitoring and Tuning
- Page 948:
454CHAPTER 22Monitoring and Tuning
- Page 952:
456CHAPTER 22Monitoring and Tuning
- Page 956:
458CHAPTER 22Monitoring and Tuning
- Page 960:
460CHAPTER 22Monitoring and Tuning
- Page 964:
This page intentionally left blank
- Page 968:
464CHAPTER 23Protecting Against Int
- Page 972:
466CHAPTER 23Protecting Against Int
- Page 976:
468CHAPTER 23Protecting Against Int
- Page 980:
470CHAPTER 23Protecting Against Int
- Page 984:
472CHAPTER 23Protecting Against Int
- Page 988:
474CHAPTER 23Protecting Against Int
- Page 992:
476CHAPTER 23Protecting Against Int
- Page 996:
478CHAPTER 24Configuring a Firewall
- Page 1000:
480CHAPTER 24Configuring a Firewall
- Page 1004:
482CHAPTER 24Configuring a Firewall
- Page 1008:
484CHAPTER 24Configuring a Firewall
- Page 1012:
486CHAPTER 24Configuring a Firewall
- Page 1016:
488CHAPTER 24Configuring a Firewall
- Page 1020:
490CHAPTER 24Configuring a Firewall
- Page 1024:
492CHAPTER 24Configuring a Firewall
- Page 1028:
494CHAPTER 24Configuring a Firewall
- Page 1032:
496CHAPTER 24Configuring a Firewall
- Page 1036:
498CHAPTER 24Configuring a Firewall
- Page 1040:
500CHAPTER 24Configuring a Firewall
- Page 1044:
502CHAPTER 24Configuring a Firewall
- Page 1048:
504CHAPTER 24Configuring a Firewall
- Page 1052:
506CHAPTER 25Linux Auditing System.
- Page 1056:
508CHAPTER 25Linux Auditing Systemm
- Page 1060:
510CHAPTER 25Linux Auditing SystemW
- Page 1064:
512CHAPTER 25Linux Auditing Systemm
- Page 1068:
514CHAPTER 25Linux Auditing SystemL
- Page 1072:
516CHAPTER 25Linux Auditing SystemI
- Page 1076:
518CHAPTER 25Linux Auditing SystemT
- Page 1080:
520CHAPTER 25Linux Auditing SystemT
- Page 1084:
522CHAPTER 25Linux Auditing SystemS
- Page 1088:
This page intentionally left blank
- Page 1092:
526APPENDIX AInstalling Proprietary
- Page 1096:
528APPENDIX AInstalling Proprietary
- Page 1100:
530APPENDIX BCreating Virtual Machi
- Page 1104:
532APPENDIX BCreating Virtual Machi
- Page 1108:
534APPENDIX BCreating Virtual Machi
- Page 1112:
536APPENDIX BCreating Virtual Machi
- Page 1116:
538APPENDIX BCreating Virtual Machi
- Page 1120:
540APPENDIX BCreating Virtual Machi
- Page 1124:
542APPENDIX BCreating Virtual Machi
- Page 1128:
544APPENDIX BCreating Virtual Machi
- Page 1132:
546APPENDIX BCreating Virtual Machi
- Page 1136:
548APPENDIX CPreventing Security Br
- Page 1140:
550APPENDIX CPreventing Security Br
- Page 1144:
552APPENDIX DTroubleshootingQ. I di
- Page 1148:
554APPENDIX DTroubleshootingQ. When
- Page 1152:
556APPENDIX DTroubleshootingQ. I ne
- Page 1156:
558APPENDIX DTroubleshootingSecurit
- Page 1160:
560addingaddingdisk space to LVM, 1
- Page 1164:
562autofsautofsconnecting NFS share
- Page 1168:
564Configuration Administrator role
- Page 1172:
566directivesdirectives/etc/httpd/c
- Page 1176:
568Encrypt Passwords option (Samba
- Page 1180:
570filesystemsfinding files in dire
- Page 1184:
572helper match extension (IPTables
- Page 1188:
574IPTablesconfiguring, 477examples
- Page 1192:
576LDAP (Lightweight Directory Acce
- Page 1196:
578loginssecure file transfers, 359
- Page 1200:
580modulesmoduleskernel modulesinst
- Page 1204:
582NFS (Network File System)server
- Page 1208:
584passphrasespassphrasescreating v
- Page 1212:
586Red Hat Network Provisioning, Li
- Page 1216:
588scriptsscriptsAwk, 249Bash, 239c
- Page 1220:
590sharesSambaadding to, 309adding
- Page 1224:
592storageLVM schemes, 168-169remov
- Page 1228:
594umount command, removing logical
- Page 1232:
596vmstat command, reporting memory


