- Page 1:
Detection and Prediction of Errors
- Page 5 and 6:
Abstract Business process modeling
- Page 7 and 8:
Acknowledgement On these pages it i
- Page 9 and 10:
Contents List of Figures iv List of
- Page 11 and 12:
Contents iii 4.3.4 Reduction of the
- Page 13 and 14:
List of Figures 1.1 Information Sys
- Page 15 and 16:
List of Figures vii 4.15 Reduction
- Page 17 and 18:
List of Figures ix A.5 Asset Accoun
- Page 19 and 20:
List of Figures xi A.40 Plant Maint
- Page 21 and 22:
List of Figures xiii A.77 Sales and
- Page 23 and 24:
List of Figures xv B.23 Personnel T
- Page 25 and 26:
List of Figures xvii C.3 Box plot f
- Page 27 and 28:
List of Figures xix C.59 Box plot f
- Page 29 and 30:
List of Tables 3.1 Overview of appr
- Page 31 and 32:
List of Acronyms ACM Association fo
- Page 33 and 34:
Table of Acronyms xxv WS-CDL Web Se
- Page 35 and 36:
Chapter 1 Introduction This chapter
- Page 37 and 38:
1.2. Research Contributions 3 1.2 R
- Page 39 and 40:
1.3. Epistemological Position 5 wit
- Page 41 and 42: 1.3. Epistemological Position 7 lem
- Page 43 and 44: 1.3. Epistemological Position 9 The
- Page 45 and 46: 1.3. Epistemological Position 11 ce
- Page 47 and 48: 1.4. Structure of this Thesis 13 ne
- Page 49 and 50: 3.4. EPC Semantics 53 a decision ha
- Page 51 and 52: 3.4. EPC Semantics 55 c1 c2 e1 f1 e
- Page 53 and 54: 3.4. EPC Semantics 57 e2 f2 a3 a4 a
- Page 55 and 56: 3.4. EPC Semantics 59 Boolean net.
- Page 57 and 58: 3.4. EPC Semantics 61 Even though t
- Page 59 and 60: 3.4. EPC Semantics 63 mann propose
- Page 61 and 62: 3.4. EPC Semantics 65 Table 3.3 sum
- Page 63 and 64: 3.4. EPC Semantics 67 In the follow
- Page 65 and 66: 3.4. EPC Semantics 69 token. The di
- Page 67 and 68: 3.4. EPC Semantics 71 have a wait c
- Page 69 and 70: 3.4. EPC Semantics 73 d dead contex
- Page 71 and 72: 3.4. EPC Semantics 75 (a) (b) (c) (
- Page 73 and 74: 3.4. EPC Semantics 77 (a) d (b) (c)
- Page 75 and 76: 3.4. EPC Semantics 79 • Figure 3.
- Page 77 and 78: 3.4. EPC Semantics 81 assigns a pos
- Page 79 and 80: 3.4. EPC Semantics 83 are in a wait
- Page 81 and 82: 3.4. EPC Semantics 85 • m → −
- Page 83 and 84: 3.4. EPC Semantics 87 is set to dea
- Page 85 and 86: 3.4. EPC Semantics 89 • m ∗ →
- Page 87 and 88: 3.4. EPC Semantics 91 Algorithm 1 P
- Page 89 and 90: 3.4. EPC Semantics 93 format [IDS03
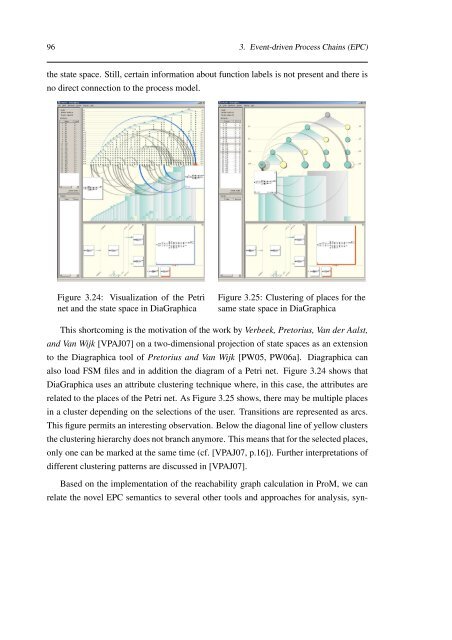
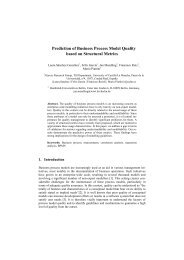
- Page 91: 3.4. EPC Semantics 95 Figure 3.22:
- Page 95 and 96: 224 A. Errors found with xoEPC Anal
- Page 97 and 98: 226 A. Errors found with xoEPC Post
- Page 99 and 100: 228 A. Errors found with xoEPC Post
- Page 101 and 102: 230 A. Errors found with xoEPC Need
- Page 103 and 104: 232 A. Errors found with xoEPC Need
- Page 105 and 106: 234 A. Errors found with xoEPC Need
- Page 107 and 108: 236 A. Errors found with xoEPC Capa
- Page 109 and 110: 238 A. Errors found with xoEPC Shop
- Page 111 and 112: 240 A. Errors found with xoEPC Open
- Page 113 and 114: 242 A. Errors found with xoEPC Requ
- Page 115 and 116: 244 A. Errors found with xoEPC Mat.
- Page 117 and 118: 246 A. Errors found with xoEPC Chec
- Page 119 and 120: 248 A. Errors found with xoEPC Comp
- Page 121 and 122: 250 A. Errors found with xoEPC Budg
- Page 123 and 124: 252 A. Errors found with xoEPC Paym
- Page 125 and 126: 254 A. Errors found with xoEPC Mate
- Page 127 and 128: 256 A. Errors found with xoEPC Prov
- Page 129 and 130: 258 A. Errors found with xoEPC Need
- Page 131 and 132: 260 A. Errors found with xoEPC Empl
- Page 133 and 134: 262 A. Errors found with xoEPC Exte
- Page 135 and 136: 264 A. Errors found with xoEPC Capa
- Page 137 and 138: 266 A. Errors found with xoEPC Main
- Page 139 and 140: 268 A. Errors found with xoEPC Capa
- Page 141 and 142: 270 A. Errors found with xoEPC Capa
- Page 143 and 144:
272 A. Errors found with xoEPC Main
- Page 145 and 146:
274 A. Errors found with xoEPC With
- Page 147 and 148:
276 A. Errors found with xoEPC Proj
- Page 149 and 150:
278 A. Errors found with xoEPC Peri
- Page 151 and 152:
280 A. Errors found with xoEPC Ente
- Page 153 and 154:
282 A. Errors found with xoEPC Ente
- Page 155 and 156:
284 A. Errors found with xoEPC Insp
- Page 157 and 158:
286 A. Errors found with xoEPC Main
- Page 159 and 160:
288 A. Errors found with xoEPC Serv
- Page 161 and 162:
290 A. Errors found with xoEPC Need
- Page 163 and 164:
292 A. Errors found with xoEPC Recr
- Page 165 and 166:
294 A. Errors found with xoEPC Seco
- Page 167 and 168:
296 A. Errors found with xoEPC Deli
- Page 169 and 170:
298 A. Errors found with xoEPC Deli
- Page 171 and 172:
300 A. Errors found with xoEPC Quot
- Page 173 and 174:
302 A. Errors found with xoEPC Good
- Page 175 and 176:
304 A. Errors found with xoEPC Spec
- Page 177 and 178:
306 A. Errors found with xoEPC Nett
- Page 179 and 180:
308 A. Errors found with xoEPC Nett
- Page 181 and 182:
310 A. Errors found with xoEPC Nett
- Page 183 and 184:
312 A. Errors found with xoEPC OTC
- Page 185 and 186:
314 A. Errors found with xoEPC
- Page 187 and 188:
316 B. EPCs not completely reduced
- Page 189 and 190:
318 B. EPCs not completely reduced
- Page 191 and 192:
320 B. EPCs not completely reduced
- Page 193 and 194:
322 B. EPCs not completely reduced
- Page 195 and 196:
324 B. EPCs not completely reduced
- Page 197 and 198:
326 B. EPCs not completely reduced
- Page 199 and 200:
328 B. EPCs not completely reduced
- Page 201 and 202:
330 B. EPCs not completely reduced
- Page 203 and 204:
332 B. EPCs not completely reduced
- Page 205 and 206:
334 B. EPCs not completely reduced
- Page 207 and 208:
336 B. EPCs not completely reduced
- Page 209 and 210:
338 B. EPCs not completely reduced
- Page 211 and 212:
340 B. EPCs not completely reduced
- Page 213 and 214:
342 B. EPCs not completely reduced
- Page 215 and 216:
344 B. EPCs not completely reduced
- Page 217 and 218:
346 B. EPCs not completely reduced
- Page 219 and 220:
348 B. EPCs not completely reduced
- Page 221 and 222:
350 B. EPCs not completely reduced
- Page 223 and 224:
352 B. EPCs not completely reduced
- Page 225 and 226:
354 B. EPCs not completely reduced
- Page 227 and 228:
356 B. EPCs not completely reduced
- Page 229 and 230:
358 B. EPCs not completely reduced
- Page 231 and 232:
360 B. EPCs not completely reduced
- Page 233 and 234:
362 B. EPCs not completely reduced
- Page 235 and 236:
364 B. EPCs not completely reduced
- Page 237 and 238:
366 B. EPCs not completely reduced
- Page 239 and 240:
368 B. EPCs not completely reduced
- Page 241 and 242:
370 B. EPCs not completely reduced
- Page 243 and 244:
372 B. EPCs not completely reduced
- Page 245 and 246:
374 C. Descriptive Statistics of Va
- Page 247 and 248:
376 C. Descriptive Statistics of Va
- Page 249 and 250:
378 C. Descriptive Statistics of Va
- Page 251 and 252:
380 C. Descriptive Statistics of Va
- Page 253 and 254:
382 C. Descriptive Statistics of Va
- Page 255 and 256:
384 C. Descriptive Statistics of Va
- Page 257 and 258:
386 C. Descriptive Statistics of Va
- Page 259 and 260:
388 C. Descriptive Statistics of Va
- Page 261 and 262:
390 C. Descriptive Statistics of Va
- Page 263 and 264:
392 C. Descriptive Statistics of Va
- Page 265 and 266:
394 C. Descriptive Statistics of Va
- Page 267 and 268:
396 C. Descriptive Statistics of Va
- Page 269 and 270:
398 C. Descriptive Statistics of Va
- Page 271 and 272:
400 C. Descriptive Statistics of Va
- Page 273 and 274:
402 C. Descriptive Statistics of Va
- Page 275 and 276:
404 C. Descriptive Statistics of Va
- Page 277 and 278:
406 C. Descriptive Statistics of Va
- Page 279 and 280:
408 C. Descriptive Statistics of Va
- Page 281 and 282:
410 C. Descriptive Statistics of Va
- Page 283 and 284:
412 C. Descriptive Statistics of Va
- Page 285 and 286:
414 C. Descriptive Statistics of Va
- Page 287 and 288:
416 C. Descriptive Statistics of Va
- Page 289 and 290:
418 C. Descriptive Statistics of Va
- Page 291 and 292:
420 C. Descriptive Statistics of Va
- Page 293 and 294:
422 C. Descriptive Statistics of Va
- Page 295 and 296:
424 C. Descriptive Statistics of Va
- Page 297 and 298:
426 C. Descriptive Statistics of Va
- Page 299 and 300:
428 D. Logistic Regression Results
- Page 301 and 302:
430 D. Logistic Regression Results
- Page 303 and 304:
432 D. Logistic Regression Results
- Page 305 and 306:
434 D. Logistic Regression Results
- Page 307 and 308:
436 D. Logistic Regression Results
- Page 309 and 310:
438 D. Logistic Regression Results
- Page 311 and 312:
440 D. Logistic Regression Results
- Page 313 and 314:
442 Bibliography [ACD + 03] T. Andr
- Page 315 and 316:
444 Bibliography [ARD + 06] W.M.P.
- Page 317 and 318:
446 Bibliography [BE05b] U. Brandes
- Page 319 and 320:
448 Bibliography [Boe81] B.W. Boehm
- Page 321 and 322:
450 Bibliography Proceedings of the
- Page 323 and 324:
452 Bibliography [DAV05] B.F. van D
- Page 325 and 326:
454 Bibliography [DZ05] J. Dehnert
- Page 327 and 328:
456 Bibliography [GD05a] A. Selçuk
- Page 329 and 330:
458 Bibliography [Gro75] E. Grochla
- Page 331 and 332:
460 Bibliography [HMPR04] A.R. Hevn
- Page 333 and 334:
462 Bibliography [IEE83] IEEE. IEEE
- Page 335 and 336:
464 Bibliography [Kie03] B. Kiepusz
- Page 337 and 338:
466 Bibliography volume 4103 of Lec
- Page 339 and 340:
468 Bibliography [Löw00] J. Löwer
- Page 341 and 342:
470 Bibliography [MH05] J. Mendling
- Page 343 and 344:
472 Bibliography many, pages 61-80,
- Page 345 and 346:
474 Bibliography Workshops at the 1
- Page 347 and 348:
476 Bibliography [Nis98] M.E. Nisse
- Page 349 and 350:
478 Bibliography [Por85] M. E. Port
- Page 351 and 352:
480 Bibliography [RV04] H.A. Reijer
- Page 353 and 354:
482 Bibliography [SF06] H. Smith an
- Page 355 and 356:
484 Bibliography on Conceptual Mode
- Page 357 and 358:
486 Bibliography A. Haller, editors
- Page 359 and 360:
488 Bibliography O. Pastor, editors
- Page 361 and 362:
490 Bibliography [WVA + 06b] M.T. W