Management's Review Business Model Risk Pension Hedging and Investment Hedging Investment Administration Social Responsibility <strong>The</strong> <strong>ATP</strong> <strong>Group</strong> Financial StatementsNote 39 Liquidity risksLiquidity risk is the risk that the <strong>ATP</strong> <strong>Group</strong> will not have sufficient fundsavailable to meet its contractual obligations when they fall due.Liquidity management at the <strong>ATP</strong> <strong>Group</strong> is conducted through continuousmonitoring and management of the <strong>Group</strong>'s liquidity risk, e.g. throughpreparation of current cash budgets. <strong>The</strong> primary objective of the <strong>Group</strong>'sliquidity management is to ensure that the <strong>Group</strong> has a cash buffer whichis sufficient to enable it to meet its contractual obligations.Liquidity risk is associated primarily with contribution payments, pensionbenefitpayouts and payment of tax on pension-savings returns.Tax on pension-savings returns is settled twice a year in the followingaccounting period, with a payment on account in February and final settlementin May. In connection with the calculation and settlement of taxon pension-savings returns, it is ensured that <strong>ATP</strong> has sufficient cash, e.g.through sale of financial assets.<strong>The</strong> <strong>Group</strong>'s cash reserves are comprised of cash and cash equivalentsand other financial assets and unutilised credit facilities.In the table below, the <strong>Group</strong>’s and <strong>ATP</strong>’s financial assets and liabilitiesare broken down by contractual maturity including interest. Equity investmentsare placed in the 0-1-year category.<strong>The</strong> net liquidity effect on contribution payments and pension payoutsover the year is very modest.Financial assets<strong>2012</strong> <strong>Group</strong> 0-1 years 1-5 years 6-15 years 16-20 yearsMore than 20yearsTotalDKK millionEquity investments 64,813 0 0 0 0 64,813Bonds 95,493 178,035 128,571 45,865 267,530 715,494Financial derivatives 188,715 71,272 145,875 65,767 129,944 601,573Loans to portfolio companies 382 103 191 86 0 762Other loans 2 21 0 0 0 23Contributions receivable 2,300 0 0 0 0 2,300Other receivables 2,751 21 0 0 0 2,772Interest receivable 5,699 0 0 0 0 5,699Receivables from credit institutions 46,273 0 0 0 0 46,273Cash and demand deposits 4,991 0 0 0 0 4,991Total 411,419 249,452 274,637 111,718 397,474 1,444,7002011 <strong>Group</strong> 0-1 years 1-5 years 6-15 years 16-20 yearsMore than 20yearsTotalDKK millionEquity investments 64,370 0 0 0 0 64,370Bonds 117,120 162,716 132,865 42,072 233,340 688,113Financial derivatives 138,905 84,492 189,723 74,577 157,316 645,013Loans to portfolio companies 54 439 333 125 0 951Other loans 18 25 0 0 0 43Contributions receivable 2,291 0 0 0 0 2,291Other receivables 10,456 0 0 0 0 10,456Interest receivable 5,337 0 0 0 0 5,337Receivables from credit institutions 57,630 0 0 0 0 57,630Cash and demand deposits 2,688 0 0 0 0 2,688Total 398,869 247,672 322,921 116,774 390,656 1,476,892<strong>The</strong> <strong>ATP</strong> <strong>Group</strong> – <strong>Annual</strong> <strong>Report</strong> <strong>2012</strong>120
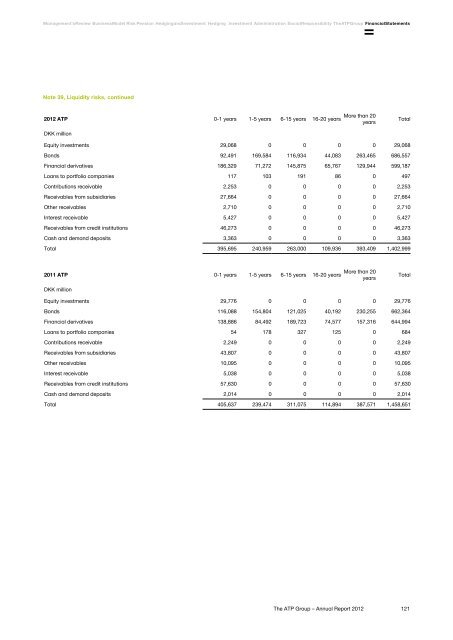
Management's Review Business Model Risk Pension Hedging and Investment Hedging Investment Administration Social Responsibility <strong>The</strong> <strong>ATP</strong> <strong>Group</strong> Financial StatementsNote 39, Liquidity risks, continued<strong>2012</strong> <strong>ATP</strong> 0-1 years 1-5 years 6-15 years 16-20 yearsMore than 20yearsTotalDKK millionEquity investments 29,068 0 0 0 0 29,068Bonds 92,491 169,584 116,934 44,083 263,465 686,557Financial derivatives 186,329 71,272 145,875 65,767 129,944 599,187Loans to portfolio companies 117 103 191 86 0 497Contributions receivable 2,253 0 0 0 0 2,253Receivables from subsidiaries 27,664 0 0 0 0 27,664Other receivables 2,710 0 0 0 0 2,710Interest receivable 5,427 0 0 0 0 5,427Receivables from credit institutions 46,273 0 0 0 0 46,273Cash and demand deposits 3,363 0 0 0 0 3,363Total 395,695 240,959 263,000 109,936 393,409 1,402,9992011 <strong>ATP</strong> 0-1 years 1-5 years 6-15 years 16-20 yearsMore than 20yearsTotalDKK millionEquity investments 29,776 0 0 0 0 29,776Bonds 116,088 154,804 121,025 40,192 230,255 662,364Financial derivatives 138,886 84,492 189,723 74,577 157,316 644,994Loans to portfolio companies 54 178 327 125 0 684Contributions receivable 2,249 0 0 0 0 2,249Receivables from subsidiaries 43,807 0 0 0 0 43,807Other receivables 10,095 0 0 0 0 10,095Interest receivable 5,038 0 0 0 0 5,038Receivables from credit institutions 57,630 0 0 0 0 57,630Cash and demand deposits 2,014 0 0 0 0 2,014Total 405,637 239,474 311,075 114,894 387,571 1,458,651<strong>The</strong> <strong>ATP</strong> <strong>Group</strong> – <strong>Annual</strong> <strong>Report</strong> <strong>2012</strong>121