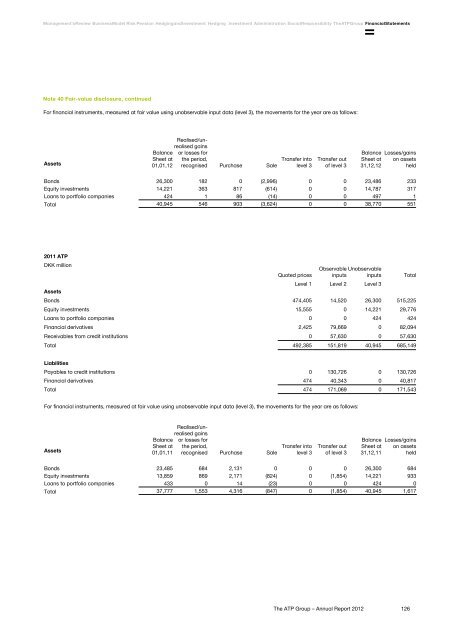
Management's Review Business Model Risk Pension Hedging and Investment Hedging Investment Administration Social Responsibility <strong>The</strong> <strong>ATP</strong> <strong>Group</strong> Financial StatementsNote 40 Fair-value disclosure, continuedFor financial instruments, measured at fair value using unobservable input data (level 3), the movements for the year are as follows:Realised/unrealisedgainsBalance or losses forSheet at the period,Assets 01,01,12 recognised Purchase SaleTransfer intolevel 3Transfer outof level 3BalanceSheet at31,12,12Losses/gainson assetsheldBonds 26,300 182 0 (2,996) 0 0 23,486 233Equity investments 14,221 363 817 (614) 0 0 14,787 317Loans to portfolio companies 424 1 86 (14) 0 0 497 1Total 40,945 546 903 (3,624) 0 0 38,770 5512011 <strong>ATP</strong>DKK millionObservable UnobservableQuoted prices inputs inputs TotalLevel 1 Level 2 Level 3AssetsBonds 474,405 14,520 26,300 515,225Equity investments 15,555 0 14,221 29,776Loans to portfolio companies 0 0 424 424Financial derivatives 2,425 79,669 0 82,094Receivables from credit institutions 0 57,630 0 57,630Total 492,385 151,819 40,945 685,149LiabilitiesPayables to credit institutions 0 130,726 0 130,726Financial derivatives 474 40,343 0 40,817Total 474 171,069 0 171,543For financial instruments, measured at fair value using unobservable input data (level 3), the movements for the year are as follows:Realised/unrealisedgainsBalance or losses forSheet at the period,Assets 01,01,11 recognised Purchase SaleTransfer intolevel 3Transfer outof level 3BalanceSheet at31,12,11Losses/gainson assetsheldBonds 23,485 684 2,131 0 0 0 26,300 684Equity investments 13,859 869 2,171 (824) 0 (1,854) 14,221 933Loans to portfolio companies 433 0 14 (23) 0 0 424 0Total 37,777 1,553 4,316 (847) 0 (1,854) 40,945 1,617<strong>The</strong> <strong>ATP</strong> <strong>Group</strong> – <strong>Annual</strong> <strong>Report</strong> <strong>2012</strong>126
Management's Review Business Model Risk Pension Hedging and Investment Hedging Investment Administration Social Responsibility <strong>The</strong> <strong>ATP</strong> <strong>Group</strong> Financial StatementsNote 41 Non-current and current assets and liabilities<strong>Group</strong> <strong>ATP</strong>DKK million <strong>2012</strong> 2011 <strong>2012</strong> 2011Non-current assets:Intangible assets 801 885 800 885Operating equipment 62 14 54 6Owner-occupied properties 805 513 781 491Investments in associates 7,889 7,217 4,888 4,291Investments in subsidiaries - - 61,927 56,502Deferred tax 12 6 - -Deferred tax on pension-savings returns 0 1 0 0Total non-current assets 9,569 8,636 68,450 62,175Current assets:Cash and demand deposits 4,991 2,688 3,363 2,014Bonds 556,335 530,456 539,677 515,225Equity investments 64,813 64,370 29,068 29,776Financial derivatives 85,232 82,113 85,226 82,094Investment assets related to unit-linked contracts 2,640 2,178 0 0Other loans 20 43 0 0Investment properties 11,587 11,125 7,421 7,060Corporation tax 0 2 - -Contributions receivable 2,300 2,291 2,253 2,249Loans to portfolio companies 762 691 497 424Receivables from subsidiaries - - 51 1,127Receivables from credit institutions 46,273 57,630 46,273 57,630Other receivables 2,772 10,456 2,710 10,095Other prepayments 664 633 660 627Interest receivable and accrued rent 5,699 5,337 5,427 5,038Total current assets 784,088 770,013 722,626 713,359Total assets 793,657 778,649 791,076 775,534<strong>Group</strong> <strong>ATP</strong>DKK million <strong>2012</strong> 2011 <strong>2012</strong> 2011Non-current liabilities:Guaranteed benefits 527,044 493,042 527,044 493,042Claims-outstanding provisions 91 75 91 75Bonus potential 84,154 74,133 84,167 74,135Provisions for unit-linked contracts 2,938 2,513 183 186Minority interests 4 4 - -Total non-current pension provisions and liabilities 614,231 569,767 611,485 567,438Current liabilities:Guaranteed benefits 12,647 11,883 12,647 11,883Payables to subsidiaries - - 681 25Financial derivatives 46,854 41,092 46,825 40,817Tax payable on pension-savings returns 8,701 18,430 8,680 18,430Payables to credit institutions 106,193 130,726 106,193 130,726Other payables 5,031 6,751 4,565 6,215Total current liabilities 179,426 208,882 179,591 208,096Total liabilities 793,657 778,649 791,076 775,534<strong>The</strong> <strong>ATP</strong> <strong>Group</strong> – <strong>Annual</strong> <strong>Report</strong> <strong>2012</strong>127