The ATP Group Annual Report 2012
The ATP Group Annual Report 2012
The ATP Group Annual Report 2012

Create successful ePaper yourself
Turn your PDF publications into a flip-book with our unique Google optimized e-Paper software.
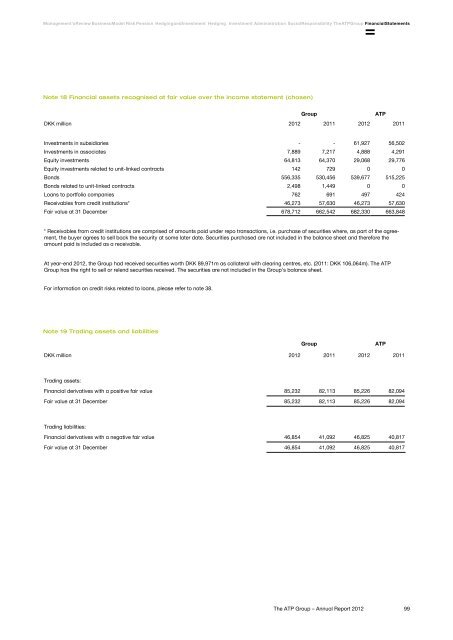
Management's Review Business Model Risk Pension Hedging and Investment Hedging Investment Administration Social Responsibility <strong>The</strong> <strong>ATP</strong> <strong>Group</strong> Financial StatementsNote 18 Financial assets recognised at fair value over the income statement (chosen)<strong>Group</strong> <strong>ATP</strong>DKK million <strong>2012</strong> 2011 <strong>2012</strong> 2011Investments in subsidiaries - - 61,927 56,502Investments in associates 7,889 7,217 4,888 4,291Equity investments 64,813 64,370 29,068 29,776Equity investments related to unit-linked contracts 142 729 0 0Bonds 556,335 530,456 539,677 515,225Bonds related to unit-linked contracts 2,498 1,449 0 0Loans to portfolio companies 762 691 497 424Receivables from credit institutions* 46,273 57,630 46,273 57,630Fair value at 31 December 678,712 662,542 682,330 663,848* Receivables from credit institutions are comprised of amounts paid under repo transactions, i.e. purchase of securities where, as part of the agreement,the buyer agrees to sell back the security at some later date. Securities purchased are not included in the balance sheet and therefore theamount paid is included as a receivable.At year-end <strong>2012</strong>, the <strong>Group</strong> had received securities worth DKK 89,971m as collateral with clearing centres, etc. (2011: DKK 106,064m). <strong>The</strong> <strong>ATP</strong><strong>Group</strong> has the right to sell or relend securities received. <strong>The</strong> securities are not included in the <strong>Group</strong>'s balance sheet.For information on credit risks related to loans, please refer to note 38.Note 19 Trading assets and liabilities<strong>Group</strong> <strong>ATP</strong>DKK million <strong>2012</strong> 2011 <strong>2012</strong> 2011Trading assets:Financial derivatives with a positive fair value 85,232 82,113 85,226 82,094Fair value at 31 December 85,232 82,113 85,226 82,094Trading liabilities:Financial derivatives with a negative fair value 46,854 41,092 46,825 40,817Fair value at 31 December 46,854 41,092 46,825 40,817<strong>The</strong> <strong>ATP</strong> <strong>Group</strong> – <strong>Annual</strong> <strong>Report</strong> <strong>2012</strong>99