The ATP Group Annual Report 2012
The ATP Group Annual Report 2012
The ATP Group Annual Report 2012

Create successful ePaper yourself
Turn your PDF publications into a flip-book with our unique Google optimized e-Paper software.
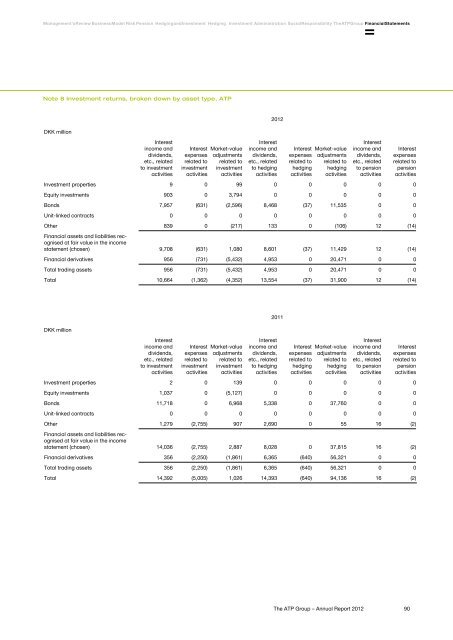
Management's Review Business Model Risk Pension Hedging and Investment Hedging Investment Administration Social Responsibility <strong>The</strong> <strong>ATP</strong> <strong>Group</strong> Financial StatementsNote 8 Investment returns, broken down by asset type, <strong>ATP</strong>DKK millionInterestincome anddividends,etc., relatedto investmentactivitiesInterestexpensesrelated toinvestmentactivitiesMarket-valueadjustmentsrelated toinvestmentactivities<strong>2012</strong>Interestincome anddividends,etc., relatedto hedgingactivitiesInterestexpensesrelated tohedgingactivitiesMarket-valueadjustmentsrelated tohedgingactivitiesInterestincome anddividends,etc., relatedto pensionactivitiesInterestexpensesrelated topensionactivitiesInvestment properties 9 0 99 0 0 0 0 0Equity investments 903 0 3,794 0 0 0 0 0Bonds 7,957 (631) (2,596) 8,468 (37) 11,535 0 0Unit-linked contracts 0 0 0 0 0 0 0 0Other 839 0 (217) 133 0 (106) 12 (14)Financial assets and liabilities recognisedat fair value in the incomestatement (chosen) 9,708 (631) 1,080 8,601 (37) 11,429 12 (14)Financial derivatives 956 (731) (5,432) 4,953 0 20,471 0 0Total trading assets 956 (731) (5,432) 4,953 0 20,471 0 0Total 10,664 (1,362) (4,352) 13,554 (37) 31,900 12 (14)DKK millionInterestincome anddividends,etc., relatedto investmentactivitiesInterestexpensesrelated toinvestmentactivitiesMarket-valueadjustmentsrelated toinvestmentactivities2011Interestincome anddividends,etc., relatedto hedgingactivitiesInterestexpensesrelated tohedgingactivitiesMarket-valueadjustmentsrelated tohedgingactivitiesInterestincome anddividends,etc., relatedto pensionactivitiesInterestexpensesrelated topensionactivitiesInvestment properties 2 0 139 0 0 0 0 0Equity investments 1,037 0 (5,127) 0 0 0 0 0Bonds 11,718 0 6,968 5,338 0 37,760 0 0Unit-linked contracts 0 0 0 0 0 0 0 0Other 1,279 (2,755) 907 2,690 0 55 16 (2)Financial assets and liabilities recognisedat fair value in the incomestatement (chosen) 14,036 (2,755) 2,887 8,028 0 37,815 16 (2)Financial derivatives 356 (2,250) (1,861) 6,365 (640) 56,321 0 0Total trading assets 356 (2,250) (1,861) 6,365 (640) 56,321 0 0Total 14,392 (5,005) 1,026 14,393 (640) 94,136 16 (2)<strong>The</strong> <strong>ATP</strong> <strong>Group</strong> – <strong>Annual</strong> <strong>Report</strong> <strong>2012</strong>90