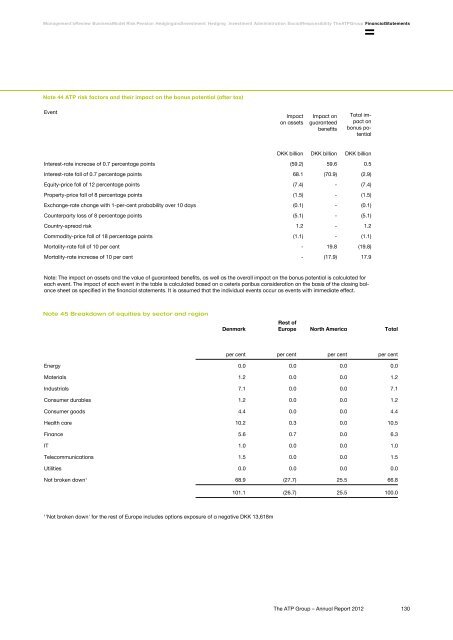
Management's Review Business Model Risk Pension Hedging and Investment Hedging Investment Administration Social Responsibility <strong>The</strong> <strong>ATP</strong> <strong>Group</strong> Financial StatementsNote 44 <strong>ATP</strong> risk factors and their impact on the bonus potential (after tax)EventImpacton assetsImpact onguaranteedbenefitsTotal impactonbonus potentialDKK billion DKK billion DKK billionInterest-rate increase of 0.7 percentage points (59.2) 59.6 0.5Interest-rate fall of 0.7 percentage points 68.1 (70.9) (2.9)Equity-price fall of 12 percentage points (7.4) - (7.4)Property-price fall of 8 percentage points (1.5) - (1.5)Exchange-rate change with 1-per-cent probability over 10 days (0.1) - (0.1)Counterparty loss of 8 percentage points (5.1) - (5.1)Country-spread risk 1.2 - 1.2Commodity-price fall of 18 percentage points (1.1) - (1.1)Mortality-rate fall of 10 per cent - 19.8 (19.8)Mortality-rate increase of 10 per cent - (17.9) 17.9Note: <strong>The</strong> impact on assets and the value of guaranteed benefits, as well as the overall impact on the bonus potential is calculated foreach event. <strong>The</strong> impact of each event in the table is calculated based on a ceteris paribus consideration on the basis of the closing balancesheet as specified in the financial statements. It is assumed that the individual events occur as events with immediate effect.Note 45 Breakdown of equities by sector and regionDenmarkRest ofEurope North America Totalper cent per cent per cent per centEnergy 0.0 0.0 0.0 0.0Materials 1.2 0.0 0.0 1.2Industrials 7.1 0.0 0.0 7.1Consumer durables 1.2 0.0 0.0 1.2Consumer goods 4.4 0.0 0.0 4.4Health care 10.2 0.3 0.0 10.5Finance 5.6 0.7 0.0 6.3IT 1.0 0.0 0.0 1.0Telecommunications 1.5 0.0 0.0 1.5Utilities 0.0 0.0 0.0 0.0Not broken down 1 68.9 (27.7) 25.5 66.8101.1 (26.7) 25.5 100.01'Not broken down' for the rest of Europe includes options exposure of a negative DKK 13,618m<strong>The</strong> <strong>ATP</strong> <strong>Group</strong> – <strong>Annual</strong> <strong>Report</strong> <strong>2012</strong>130
Management's Review Business Model Risk Pension Hedging and Investment Hedging Investment Administration Social Responsibility <strong>The</strong> <strong>ATP</strong> <strong>Group</strong> Financial StatementsNote 46 Correlation between sub-portfolio and accounting statement for <strong>ATP</strong>DKK billionHedgingportfolioInvestmentportfolioFundingaccountInvestmentstatementTotalAccountingstatementTotalDifferenceCash balance 246.2 (26.3) (218.3) 1.6 3.4 1.8Real estate 0.0 8.2 0.0 8.2 8.2 1 0.0Financial derivatives 15.6 (37.6) 0.0 (22.0) 85.2 107.2Equity investments 0.0 29.1 0.0 29.1 29.1 0.0Subsidiaries 0.0 66.8 0.0 66.8 66.8 2 0.0Bonds 305.2 240.0 0.0 545.2 539.7 (5.5)Loans to portfolio companies 0.0 0.5 0.0 0.5 0.5 0.0Other 3 0.0 0.0 0.0 0.0 58.2 4 58.2Total 567.0 280.7 5 (218.3) 6 629.4 791.1 7 161.71) Cf. the items 'Investment properties' and 'Owner-occupied properties' in <strong>ATP</strong>'s balance sheet, page 73.2) Cf. the items 'Investments in subsidiaries' and 'Investments in associates' in <strong>ATP</strong>'s balance sheet, page 73.3) Accounting items not included in the investment statement.4) Cf. the items 'Intangible assets', 'Operating equipment', 'Contributions receivable', 'Interest receivable and accrued rent', 'Other receivables', 'Deferredtax on pension-savings returns', 'Receivables from subsidiaries', 'Receivables from credit institutions' and 'Other prepayments' in <strong>ATP</strong>'s balancesheet, page 73.5) Cf. the market value of 'Total investment portfolio', page 73.6) Cf. the market value at end-<strong>2012</strong>, specified under the item 'Transferred to hedging activities', page 46.7) Cf. the item 'Total assets' in <strong>ATP</strong>’s balance sheet, page 73.8) Each figure is reconciled separately and, accordingly, rounding differences may occur.<strong>ATP</strong>'s portfolio is divided into two sub-portfolios – the hedging portfolioand the investment portfolio. As a result of this division and becauseof differences in the definition of assets for portfolio and accountingpurposes, the investment portfolio cannot be recogniseddirectly in <strong>ATP</strong>'s financial statements. Correlations between the portfolios,including their market values, and the assets in the financialstatements are set out in the table above.<strong>The</strong> table shows the various accounting assets, calculated for purposesof investment and accounting, respectively. <strong>The</strong> difference betweenthe two statements appears from the outer right-hand column.<strong>The</strong> DKK 1.8bn difference in 'Cash balance' is attributable to unsettledtrades. In the investment statement, liquidity is affected by purchaseand sale already on the trade date, while liquidity is not affected untilthe value date in the accounting statement.<strong>The</strong> DKK 107.2bn difference in 'Financial derivatives' is attributableto four factors. Firstly, the investment statement includes the net valueof positive as well as negative market values. In the accountingstatement, positive and negative market values are divided into assetsand liabilities, respectively. Thus negative market values, totallingDKK 46.8bn, are included in the accounting statement of financialderivatives, but under liabilities. Secondly, the value of repo transactionsis classified differently. <strong>The</strong> investment statement includes bothpositive and negative market values related to repo transactions underfinancial instruments. In the accounting statement, repo transactionsare included as liabilities under 'Payables to credit institutions'at a negative market value of DKK 106.2bn, while repo transactionsare included as assets under 'Receivables from credit institutions' ata positive market value of DKK 46.3bn. Denne forskel udgør netto 59,9mia. kr. For det tredje klassificeres markedsværdien af valutaterminskontrakterindgået med datterselskaber forskelligt. <strong>The</strong> investmentstatement includes the DKK 0,7bn market value under 'Financial derivatives'.In the accounting statement, these contracts are included under'Payables to subsidiaries' (liability). Finally, open futures contractsare included in the investment statement at a market value of 0, whilethe accounting statement includes these contracts at a market valueequivalent to the sum of all margin settlements paid/received underopen futures contracts. This difference is a negative DKK 0.2bn. Betweenthem, these factors explain the DKK 107.2bn difference.<strong>The</strong> difference in 'Bonds', totalling DKK 5.5bn, is attributable mainlyto the fact that interest receivable is included in the market values of<strong>The</strong> <strong>ATP</strong> <strong>Group</strong> – <strong>Annual</strong> <strong>Report</strong> <strong>2012</strong>131