The ATP Group Annual Report 2012
The ATP Group Annual Report 2012
The ATP Group Annual Report 2012

Create successful ePaper yourself
Turn your PDF publications into a flip-book with our unique Google optimized e-Paper software.
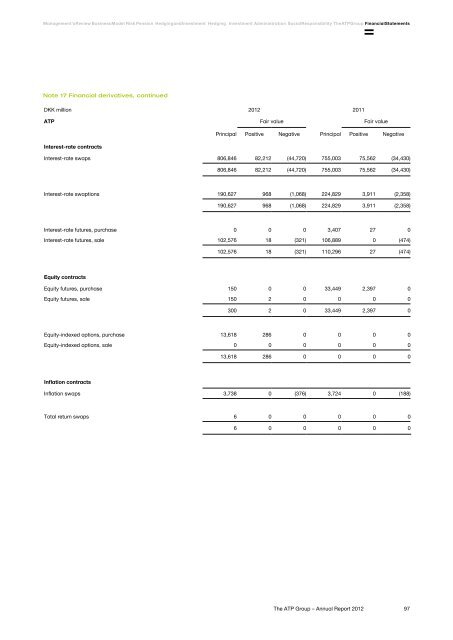
Management's Review Business Model Risk Pension Hedging and Investment Hedging Investment Administration Social Responsibility <strong>The</strong> <strong>ATP</strong> <strong>Group</strong> Financial StatementsNote 17 Financial derivatives, continuedDKK million <strong>2012</strong> 2011<strong>ATP</strong> Fair value Fair valuePrincipal Positive Negative Principal Positive NegativeInterest-rate contractsInterest-rate swaps 806,846 82,212 (44,720) 755,003 75,562 (34,430)806,846 82,212 (44,720) 755,003 75,562 (34,430)Interest-rate swaptions 190,627 968 (1,068) 224,829 3,911 (2,358)190,627 968 (1,068) 224,829 3,911 (2,358)Interest-rate futures, purchase 0 0 0 3,407 27 0Interest-rate futures, sale 102,576 18 (321) 106,889 0 (474)102,576 18 (321) 110,296 27 (474)Equity contractsEquity futures, purchase 150 0 0 33,449 2,397 0Equity futures, sale 150 2 0 0 0 0300 2 0 33,449 2,397 0Equity-indexed options, purchase 13,618 286 0 0 0 0Equity-indexed options, sale 0 0 0 0 0 013,618 286 0 0 0 0Inflation contractsInflation swaps 3,738 0 (376) 3,724 0 (188)Total return swaps 6 0 0 0 0 06 0 0 0 0 0<strong>The</strong> <strong>ATP</strong> <strong>Group</strong> – <strong>Annual</strong> <strong>Report</strong> <strong>2012</strong>97