Youth Employment Programs - Independent Evaluation Group
Youth Employment Programs - Independent Evaluation Group
Youth Employment Programs - Independent Evaluation Group

Create successful ePaper yourself
Turn your PDF publications into a flip-book with our unique Google optimized e-Paper software.
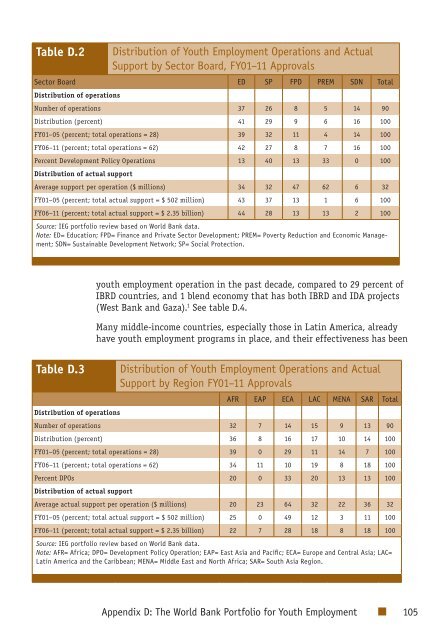
Table D.2Distribution of <strong>Youth</strong> <strong>Employment</strong> Operations and ActualSupport by Sector Board, FY01–11 ApprovalsSector Board ED SP FPD PREM SDN TotalDistribution of operationsNumber of operations 37 26 8 5 14 90Distribution (percent) 41 29 9 6 16 100FY01–05 (percent; total operations = 28) 39 32 11 4 14 100FY06–11 (percent; total operations = 62) 42 27 8 7 16 100Percent Development Policy Operations 13 40 13 33 0 100Distribution of actual supportAverage support per operation ($ millions) 34 32 47 62 6 32FY01–05 (percent; total actual support = $ 502 million) 43 37 13 1 6 100FY06–11 (percent; total actual support = $ 2.35 billion) 44 28 13 13 2 100Source: IEG portfolio review based on World Bank data.Note: ED= Education; FPD= Finance and Private Sector Development; PREM= Poverty Reduction and Economic Management;SDN= Sustainable Development Network; SP= Social Protection.youth employment operation in the past decade, compared to 29 percent ofIBRD countries, and 1 blend economy that has both IBRD and IDA projects(West Bank and Gaza). 1 See table D.4.Many middle-income countries, especially those in Latin America, alreadyhave youth employment programs in place, and their effectiveness has beenTable D.3Distribution of <strong>Youth</strong> <strong>Employment</strong> Operations and ActualSupport by Region FY01–11 ApprovalsAFR EAP ECA LAC MENA SAR TotalDistribution of operationsNumber of operations 32 7 14 15 9 13 90Distribution (percent) 36 8 16 17 10 14 100FY01–05 (percent; total operations = 28) 39 0 29 11 14 7 100FY06–11 (percent; total operations = 62) 34 11 10 19 8 18 100Percent DPOs 20 0 33 20 13 13 100Distribution of actual supportAverage actual support per operation ($ millions) 20 23 64 32 22 36 32FY01–05 (percent; total actual support = $ 502 million) 25 0 49 12 3 11 100FY06–11 (percent; total actual support = $ 2.35 billion) 22 7 28 18 8 18 100Source: IEG portfolio review based on World Bank data.Note: AFR= Africa; DPO= Development Policy Operation; EAP= East Asia and Pacific; ECA= Europe and Central Asia; LAC=Latin America and the Caribbean; MENA= Middle East and North Africa; SAR= South Asia Region.Appendix D: The World Bank Portfolio for <strong>Youth</strong> <strong>Employment</strong> 105