Facilities Master Plan - 2012 - Chesapeake College
Facilities Master Plan - 2012 - Chesapeake College
Facilities Master Plan - 2012 - Chesapeake College

Create successful ePaper yourself
Turn your PDF publications into a flip-book with our unique Google optimized e-Paper software.
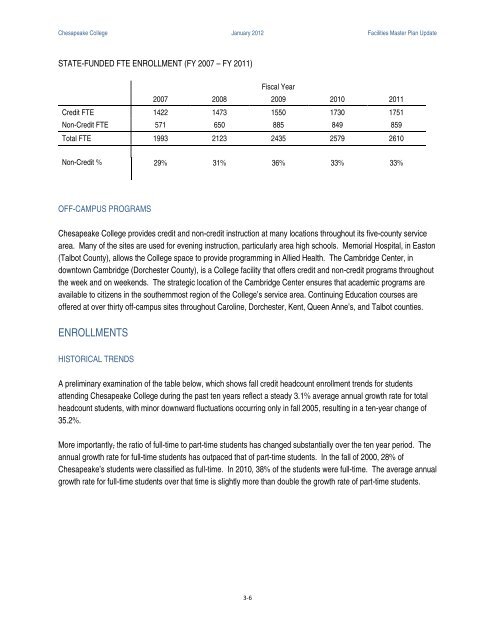
<strong>Chesapeake</strong> <strong>College</strong> January <strong>2012</strong> <strong>Facilities</strong> <strong>Master</strong> <strong>Plan</strong> UpdateSTATE-FUNDED FTE ENROLLMENT (FY 2007 – FY 2011)Fiscal Year2007 2008 2009 2010 2011Credit FTE 1422 1473 1550 1730 1751Non-Credit FTE 571 650 885 849 859Total FTE 1993 2123 2435 2579 2610Non-Credit %29% 31% 36% 33% 33%OFF-CAMPUS PROGRAMS<strong>Chesapeake</strong> <strong>College</strong> provides credit and non-credit instruction at many locations throughout its five-county servicearea. Many of the sites are used for evening instruction, particularly area high schools. Memorial Hospital, in Easton(Talbot County), allows the <strong>College</strong> space to provide programming in Allied Health. The Cambridge Center, indowntown Cambridge (Dorchester County), is a <strong>College</strong> facility that offers credit and non-credit programs throughoutthe week and on weekends. The strategic location of the Cambridge Center ensures that academic programs areavailable to citizens in the southernmost region of the <strong>College</strong>’s service area. Continuing Education courses areoffered at over thirty off-campus sites throughout Caroline, Dorchester, Kent, Queen Anne’s, and Talbot counties.ENROLLMENTSHISTORICAL TRENDSA preliminary examination of the table below, which shows fall credit headcount enrollment trends for studentsattending <strong>Chesapeake</strong> <strong>College</strong> during the past ten years reflect a steady 3.1% average annual growth rate for totalheadcount students, with minor downward fluctuations occurring only in fall 2005, resulting in a ten-year change of35.2%.More importantly, the ratio of full-time to part-time students has changed substantially over the ten year period. Theannual growth rate for full-time students has outpaced that of part-time students. In the fall of 2000, 28% of<strong>Chesapeake</strong>’s students were classified as full-time. In 2010, 38% of the students were full-time. The average annualgrowth rate for full-time students over that time is slightly more than double the growth rate of part-time students.3-6