Facilities Master Plan - 2012 - Chesapeake College
Facilities Master Plan - 2012 - Chesapeake College
Facilities Master Plan - 2012 - Chesapeake College
Create successful ePaper yourself
Turn your PDF publications into a flip-book with our unique Google optimized e-Paper software.
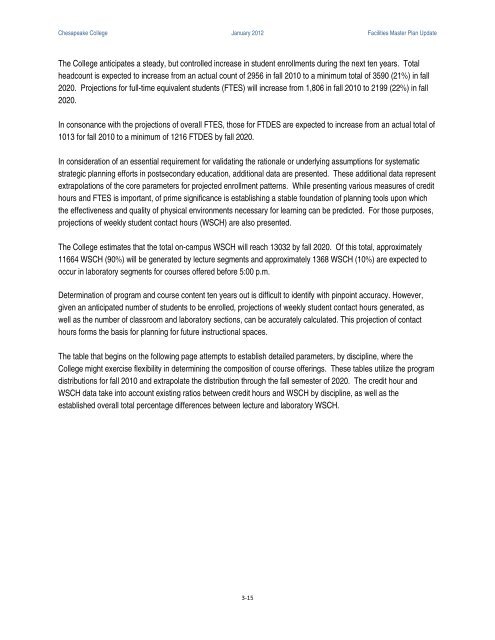
<strong>Chesapeake</strong> <strong>College</strong> January <strong>2012</strong> <strong>Facilities</strong> <strong>Master</strong> <strong>Plan</strong> UpdateThe <strong>College</strong> anticipates a steady, but controlled increase in student enrollments during the next ten years. Totalheadcount is expected to increase from an actual count of 2956 in fall 2010 to a minimum total of 3590 (21%) in fall2020. Projections for full-time equivalent students (FTES) will increase from 1,806 in fall 2010 to 2199 (22%) in fall2020.In consonance with the projections of overall FTES, those for FTDES are expected to increase from an actual total of1013 for fall 2010 to a minimum of 1216 FTDES by fall 2020.In consideration of an essential requirement for validating the rationale or underlying assumptions for systematicstrategic planning efforts in postsecondary education, additional data are presented. These additional data representextrapolations of the core parameters for projected enrollment patterns. While presenting various measures of credithours and FTES is important, of prime significance is establishing a stable foundation of planning tools upon whichthe effectiveness and quality of physical environments necessary for learning can be predicted. For those purposes,projections of weekly student contact hours (WSCH) are also presented.The <strong>College</strong> estimates that the total on-campus WSCH will reach 13032 by fall 2020. Of this total, approximately11664 WSCH (90%) will be generated by lecture segments and approximately 1368 WSCH (10%) are expected tooccur in laboratory segments for courses offered before 5:00 p.m.Determination of program and course content ten years out is difficult to identify with pinpoint accuracy. However,given an anticipated number of students to be enrolled, projections of weekly student contact hours generated, aswell as the number of classroom and laboratory sections, can be accurately calculated. This projection of contacthours forms the basis for planning for future instructional spaces.The table that begins on the following page attempts to establish detailed parameters, by discipline, where the<strong>College</strong> might exercise flexibility in determining the composition of course offerings. These tables utilize the programdistributions for fall 2010 and extrapolate the distribution through the fall semester of 2020. The credit hour andWSCH data take into account existing ratios between credit hours and WSCH by discipline, as well as theestablished overall total percentage differences between lecture and laboratory WSCH.3-15


