Competing in the Single Market - SMEs and ... - Erhvervsstyrelsen
Competing in the Single Market - SMEs and ... - Erhvervsstyrelsen
Competing in the Single Market - SMEs and ... - Erhvervsstyrelsen
Create successful ePaper yourself
Turn your PDF publications into a flip-book with our unique Google optimized e-Paper software.
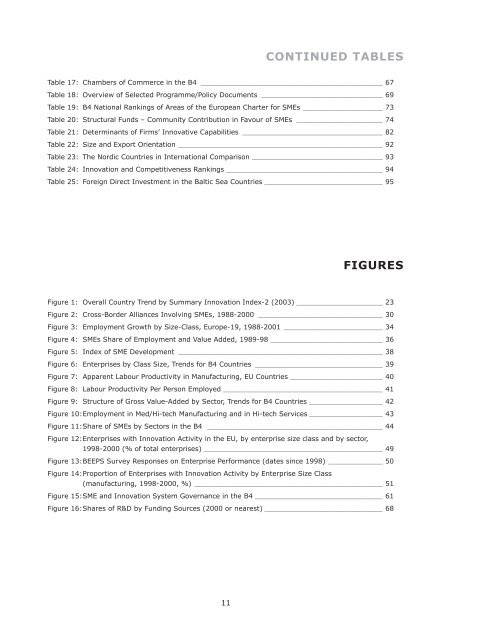
CONTINUED TABLESTable 17: Chambers of Commerce <strong>in</strong> <strong>the</strong> B4 _________________________________________________________ 67Table 18: Overview of Selected Programme/Policy Documents ______________________________________ 69Table 19: B4 National Rank<strong>in</strong>gs of Areas of <strong>the</strong> European Charter for <strong>SMEs</strong> _________________________ 73Table 20: Structural Funds – Community Contribution <strong>in</strong> Favour of <strong>SMEs</strong> ___________________________ 74Table 21: Determ<strong>in</strong>ants of Firms’ Innovative Capabilities ____________________________________________ 82Table 22: Size <strong>and</strong> Export Orientation ________________________________________________________________ 92Table 23: The Nordic Countries <strong>in</strong> International Comparison _________________________________________ 93Table 24: Innovation <strong>and</strong> Competitiveness Rank<strong>in</strong>gs _________________________________________________ 94Table 25: Foreign Direct Investment <strong>in</strong> <strong>the</strong> Baltic Sea Countries _____________________________________ 95FIGURESFigure 1: Overall Country Trend by Summary Innovation Index-2 (2003) ___________________________ 23Figure 2: Cross-Border Alliances Involv<strong>in</strong>g <strong>SMEs</strong>, 1988-2000 _______________________________________ 30Figure 3: Employment Growth by Size-Class, Europe-19, 1988-2001 _______________________________ 34Figure 4: <strong>SMEs</strong> Share of Employment <strong>and</strong> Value Added, 1989-98 ___________________________________ 36Figure 5: Index of SME Development ________________________________________________________________ 38Figure 6: Enterprises by Class Size, Trends for B4 Countries ________________________________________ 39Figure 7: Apparent Labour Productivity <strong>in</strong> Manufactur<strong>in</strong>g, EU Countries _____________________________ 40Figure 8: Labour Productivity Per Person Employed __________________________________________________ 41Figure 9: Structure of Gross Value-Added by Sector, Trends for B4 Countries _______________________ 42Figure 10: Employment <strong>in</strong> Med/Hi-tech Manufactur<strong>in</strong>g <strong>and</strong> <strong>in</strong> Hi-tech Services _______________________ 43Figure 11: Share of <strong>SMEs</strong> by Sectors <strong>in</strong> <strong>the</strong> B4 _______________________________________________________ 44Figure 12: Enterprises with Innovation Activity <strong>in</strong> <strong>the</strong> EU, by enterprise size class <strong>and</strong> by sector,1998-2000 (% of total enterprises) ________________________________________________________ 49Figure 13: BEEPS Survey Responses on Enterprise Performance (dates s<strong>in</strong>ce 1998) _________________ 50Figure 14: Proportion of Enterprises with Innovation Activity by Enterprise Size Class(manufactur<strong>in</strong>g, 1998-2000, %) ___________________________________________________________ 51Figure 15: SME <strong>and</strong> Innovation System Governance <strong>in</strong> <strong>the</strong> B4 ________________________________________ 61Figure 16: Shares of R&D by Fund<strong>in</strong>g Sources (2000 or nearest) _____________________________________ 6811


