Competing in the Single Market - SMEs and ... - Erhvervsstyrelsen
Competing in the Single Market - SMEs and ... - Erhvervsstyrelsen
Competing in the Single Market - SMEs and ... - Erhvervsstyrelsen

Create successful ePaper yourself
Turn your PDF publications into a flip-book with our unique Google optimized e-Paper software.
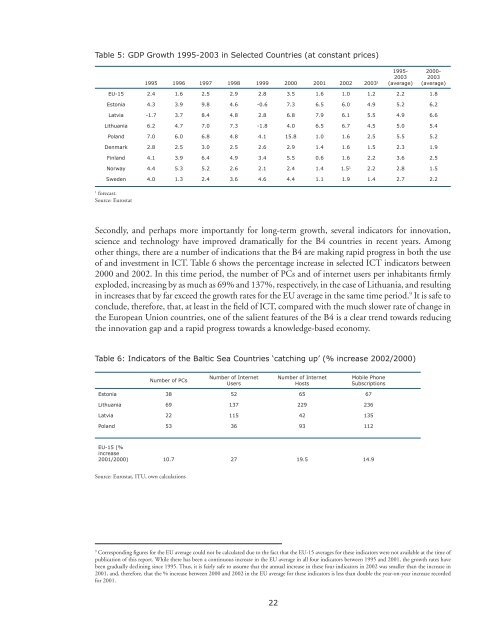
Table 5: GDP Growth 1995-2003 <strong>in</strong> Selected Countries (at constant prices)1995 1996 1997 1998 1999 2000 2001 2002 2003 1 (average)1995-20032000-2003(average)EU-15 2.4 1.6 2.5 2.9 2.8 3.5 1.6 1.0 1.2 2.2 1.8Estonia 4.3 3.9 9.8 4.6 -0.6 7.3 6.5 6.0 4.9 5.2 6.2Latvia -1.7 3.7 8.4 4.8 2.8 6.8 7.9 6.1 5.5 4.9 6.6Lithuania 6.2 4.7 7.0 7.3 -1.8 4.0 6.5 6.7 4.5 5.0 5.4Pol<strong>and</strong> 7.0 6.0 6.8 4.8 4.1 15.8 1.0 1.6 2.5 5.5 5.2Denmark 2.8 2.5 3.0 2.5 2.6 2.9 1.4 1.6 1.5 2.3 1.9F<strong>in</strong>l<strong>and</strong> 4.1 3.9 6.4 4.9 3.4 5.5 0.6 1.6 2.2 3.6 2.5Norway 4.4 5.3 5.2 2.6 2.1 2.4 1.4 1.5 1 2.2 2.8 1.5Sweden 4.0 1.3 2.4 3.6 4.6 4.4 1.1 1.9 1.4 2.7 2.21forecast.Source: EurostatSecondly, <strong>and</strong> perhaps more importantly for long-term growth, several <strong>in</strong>dicators for <strong>in</strong>novation,science <strong>and</strong> technology have improved dramatically for <strong>the</strong> B4 countries <strong>in</strong> recent years. Amongo<strong>the</strong>r th<strong>in</strong>gs, <strong>the</strong>re are a number of <strong>in</strong>dications that <strong>the</strong> B4 are mak<strong>in</strong>g rapid progress <strong>in</strong> both <strong>the</strong> useof <strong>and</strong> <strong>in</strong>vestment <strong>in</strong> ICT. Table 6 shows <strong>the</strong> percentage <strong>in</strong>crease <strong>in</strong> selected ICT <strong>in</strong>dicators between2000 <strong>and</strong> 2002. In this time period, <strong>the</strong> number of PCs <strong>and</strong> of <strong>in</strong>ternet users per <strong>in</strong>habitants firmlyexploded, <strong>in</strong>creas<strong>in</strong>g by as much as 69% <strong>and</strong> 137%, respectively, <strong>in</strong> <strong>the</strong> case of Lithuania, <strong>and</strong> result<strong>in</strong>g<strong>in</strong> <strong>in</strong>creases that by far exceed <strong>the</strong> growth rates for <strong>the</strong> EU average <strong>in</strong> <strong>the</strong> same time period. 9 It is safe toconclude, <strong>the</strong>refore, that, at least <strong>in</strong> <strong>the</strong> field of ICT, compared with <strong>the</strong> much slower rate of change <strong>in</strong><strong>the</strong> European Union countries, one of <strong>the</strong> salient features of <strong>the</strong> B4 is a clear trend towards reduc<strong>in</strong>g<strong>the</strong> <strong>in</strong>novation gap <strong>and</strong> a rapid progress towards a knowledge-based economy.Table 6: Indicators of <strong>the</strong> Baltic Sea Countries ‘catch<strong>in</strong>g up’ (% <strong>in</strong>crease 2002/2000)Number of PCsNumber of InternetUsersNumber of InternetHostsMobile PhoneSubscriptionsEstonia 38 52 65 67Lithuania 69 137 229 236Latvia 22 115 42 135Pol<strong>and</strong> 53 36 93 112EU-15 (%<strong>in</strong>crease2001/2000) 10.7 27 19.5 14.9Source: Eurostat, ITU, own calculations9Correspond<strong>in</strong>g figures for <strong>the</strong> EU average could not be calculated due to <strong>the</strong> fact that <strong>the</strong> EU-15 averages for <strong>the</strong>se <strong>in</strong>dicators were not available at <strong>the</strong> time ofpublication of this report. While <strong>the</strong>re has been a cont<strong>in</strong>uous <strong>in</strong>crease <strong>in</strong> <strong>the</strong> EU average <strong>in</strong> all four <strong>in</strong>dicators between 1995 <strong>and</strong> 2001, <strong>the</strong> growth rates havebeen gradually decl<strong>in</strong><strong>in</strong>g s<strong>in</strong>ce 1995. Thus, it is fairly safe to assume that <strong>the</strong> annual <strong>in</strong>crease <strong>in</strong> <strong>the</strong>se four <strong>in</strong>dicators <strong>in</strong> 2002 was smaller than <strong>the</strong> <strong>in</strong>crease <strong>in</strong>2001, <strong>and</strong>, <strong>the</strong>refore, that <strong>the</strong> % <strong>in</strong>crease between 2000 <strong>and</strong> 2002 <strong>in</strong> <strong>the</strong> EU average for <strong>the</strong>se <strong>in</strong>dicators is less than double <strong>the</strong> year-on-year <strong>in</strong>crease recordedfor 2001.22