Competing in the Single Market - SMEs and ... - Erhvervsstyrelsen
Competing in the Single Market - SMEs and ... - Erhvervsstyrelsen
Competing in the Single Market - SMEs and ... - Erhvervsstyrelsen

You also want an ePaper? Increase the reach of your titles
YUMPU automatically turns print PDFs into web optimized ePapers that Google loves.
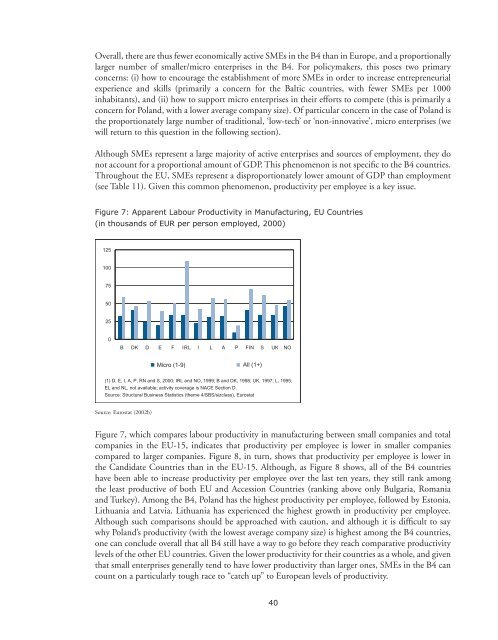
Overall, <strong>the</strong>re are thus fewer economically active <strong>SMEs</strong> <strong>in</strong> <strong>the</strong> B4 than <strong>in</strong> Europe, <strong>and</strong> a proportionallylarger number of smaller/micro enterprises <strong>in</strong> <strong>the</strong> B4. For policymakers, this poses two primaryconcerns: (i) how to encourage <strong>the</strong> establishment of more <strong>SMEs</strong> <strong>in</strong> order to <strong>in</strong>crease entrepreneurialexperience <strong>and</strong> skills (primarily a concern for <strong>the</strong> Baltic countries, with fewer <strong>SMEs</strong> per 1000<strong>in</strong>habitants), <strong>and</strong> (ii) how to support micro enterprises <strong>in</strong> <strong>the</strong>ir efforts to compete (this is primarily aconcern for Pol<strong>and</strong>, with a lower average company size). Of particular concern <strong>in</strong> <strong>the</strong> case of Pol<strong>and</strong> is<strong>the</strong> proportionately large number of traditional, ‘low-tech’ or ‘non-<strong>in</strong>novative’, micro enterprises (wewill return to this question <strong>in</strong> <strong>the</strong> follow<strong>in</strong>g section).Although <strong>SMEs</strong> represent a large majority of active enterprises <strong>and</strong> sources of employment, <strong>the</strong>y donot account for a proportional amount of GDP. This phenomenon is not specific to <strong>the</strong> B4 countries.Throughout <strong>the</strong> EU, <strong>SMEs</strong> represent a disproportionately lower amount of GDP than employment(see Table 11). Given this common phenomenon, productivity per employee is a key issue.Figure 7: Apparent Labour Productivity <strong>in</strong> Manufactur<strong>in</strong>g, EU Countries(<strong>in</strong> thous<strong>and</strong>s of EUR per person employed, 2000)1251007550250B DK D E F IRL I L A P FIN S UK NOMicro (1-9) All (1+)(1) D, E, I, A, P, RN <strong>and</strong> S, 2000; IRL <strong>and</strong> NO, 1999; B <strong>and</strong> DK, 1998; UK, 1997; L, 1995;EL <strong>and</strong> NL, not available; activity coverage is NACE Section D.Source: Structural Bus<strong>in</strong>ess Statistics (<strong>the</strong>me 4/SBS/sizclass), EurostatSource: Eurostat (2002b)Figure 7, which compares labour productivity <strong>in</strong> manufactur<strong>in</strong>g between small companies <strong>and</strong> totalcompanies <strong>in</strong> <strong>the</strong> EU-15, <strong>in</strong>dicates that productivity per employee is lower <strong>in</strong> smaller companiescompared to larger companies. Figure 8, <strong>in</strong> turn, shows that productivity per employee is lower <strong>in</strong><strong>the</strong> C<strong>and</strong>idate Countries than <strong>in</strong> <strong>the</strong> EU-15. Although, as Figure 8 shows, all of <strong>the</strong> B4 countrieshave been able to <strong>in</strong>crease productivity per employee over <strong>the</strong> last ten years, <strong>the</strong>y still rank among<strong>the</strong> least productive of both EU <strong>and</strong> Accession Countries (rank<strong>in</strong>g above only Bulgaria, Romania<strong>and</strong> Turkey). Among <strong>the</strong> B4, Pol<strong>and</strong> has <strong>the</strong> highest productivity per employee, followed by Estonia,Lithuania <strong>and</strong> Latvia. Lithuania has experienced <strong>the</strong> highest growth <strong>in</strong> productivity per employee.Although such comparisons should be approached with caution, <strong>and</strong> although it is difficult to saywhy Pol<strong>and</strong>’s productivity (with <strong>the</strong> lowest average company size) is highest among <strong>the</strong> B4 countries,one can conclude overall that all B4 still have a way to go before <strong>the</strong>y reach comparative productivitylevels of <strong>the</strong> o<strong>the</strong>r EU countries. Given <strong>the</strong> lower productivity for <strong>the</strong>ir countries as a whole, <strong>and</strong> giventhat small enterprises generally tend to have lower productivity than larger ones, <strong>SMEs</strong> <strong>in</strong> <strong>the</strong> B4 cancount on a particularly tough race to “catch up” to European levels of productivity.40