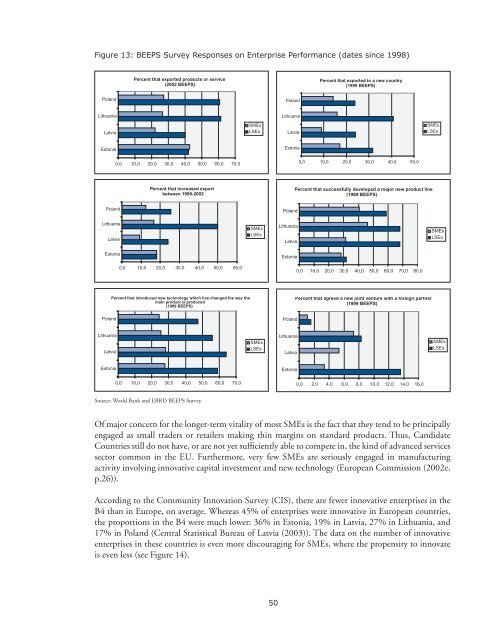
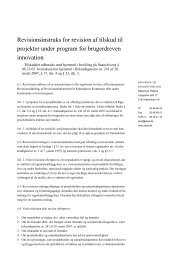
Figure 13: BEEPS Survey Responses on Enterprise Performance (dates s<strong>in</strong>ce 1998)Percent that exported products or service(2002 BEEPS)Percent that exported to a new country(1999 BEEPS)Pol<strong>and</strong>Pol<strong>and</strong>LithuaniaLithuaniaLatvia<strong>SMEs</strong>LSEsLatvia<strong>SMEs</strong>LSEsEstoniaEstonia0,0 10,0 20,0 30,0 40,0 50,0 60,0 70,00,0 10,0 20,0 30,0 40,0 50,0Percent that <strong>in</strong>creased exportsbetween 1998-2002Percent that successfully developed a major new product l<strong>in</strong>e(1999 BEEPS)Pol<strong>and</strong>Pol<strong>and</strong>LithuaniaLatvia<strong>SMEs</strong>LSEsLithuaniaLatvia<strong>SMEs</strong>LSEsEstoniaEstonia0,0 10,0 20,0 30,0 40,0 50,0 60,00,0 10,0 20,0 30,0 40,0 50,0 60,0 70,0 80,0Percent that <strong>in</strong>troduced new technology which has changed <strong>the</strong> way <strong>the</strong>ma<strong>in</strong> product is produced(1999 BEEPS)Percent that agreed a new jo<strong>in</strong>t venture with a foreign partner(1999 BEEPS)Pol<strong>and</strong>Pol<strong>and</strong>LithuaniaLatvia<strong>SMEs</strong>LSEsLithuaniaLatvia<strong>SMEs</strong>LSEsEstoniaEstonia0,0 10,0 20,0 30,0 40,0 50,0 60,0 70,00,0 2,0 4,0 6,0 8,0 10,0 12,0 14,0 16,0Source: World Bank <strong>and</strong> EBRD BEEPS SurveyOf major concern for <strong>the</strong> longer-term vitality of most <strong>SMEs</strong> is <strong>the</strong> fact that <strong>the</strong>y tend to be pr<strong>in</strong>cipallyengaged as small traders or retailers mak<strong>in</strong>g th<strong>in</strong> marg<strong>in</strong>s on st<strong>and</strong>ard products. Thus, C<strong>and</strong>idateCountries still do not have, or are not yet sufficiently able to compete <strong>in</strong>, <strong>the</strong> k<strong>in</strong>d of advanced servicessector common <strong>in</strong> <strong>the</strong> EU. Fur<strong>the</strong>rmore, very few <strong>SMEs</strong> are seriously engaged <strong>in</strong> manufactur<strong>in</strong>gactivity <strong>in</strong>volv<strong>in</strong>g <strong>in</strong>novative capital <strong>in</strong>vestment <strong>and</strong> new technology (European Commission (2002e,p.26)).Accord<strong>in</strong>g to <strong>the</strong> Community Innovation Survey (CIS), <strong>the</strong>re are fewer <strong>in</strong>novative enterprises <strong>in</strong> <strong>the</strong>B4 than <strong>in</strong> Europe, on average. Whereas 45% of enterprises were <strong>in</strong>novative <strong>in</strong> European countries,<strong>the</strong> proportions <strong>in</strong> <strong>the</strong> B4 were much lower: 36% <strong>in</strong> Estonia, 19% <strong>in</strong> Latvia, 27% <strong>in</strong> Lithuania, <strong>and</strong>17% <strong>in</strong> Pol<strong>and</strong> (Central Statistical Bureau of Latvia (2003)). The data on <strong>the</strong> number of <strong>in</strong>novativeenterprises <strong>in</strong> <strong>the</strong>se countries is even more discourag<strong>in</strong>g for <strong>SMEs</strong>, where <strong>the</strong> propensity to <strong>in</strong>novateis even less (see Figure 14).50
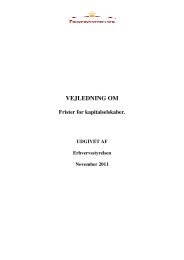
Figure 14: Proportion of Enterprises with Innovation Activity by Enterprise Size Class(manufactur<strong>in</strong>g, 1998-2000, %)706056605043403020141528282112243216331717TotalSmallMediumLarge10760Latvia Lithuania Pol<strong>and</strong> Slovenia SlovakiaSource: Eurostat (2004a)In this context, a recent study on <strong>in</strong>novation <strong>in</strong> <strong>SMEs</strong> <strong>in</strong> Pol<strong>and</strong>, carried out by <strong>the</strong> Polish Agencyfor Enterprise Development (PAED), found that R&D cooperation of <strong>SMEs</strong>, <strong>in</strong>clud<strong>in</strong>g cooperationwith universities, <strong>in</strong>stitutes <strong>and</strong> <strong>in</strong>novation centres, was very low when compared with EU countries(PAED (2003)). Similarly, survey results presented <strong>in</strong> an Estonian survey on <strong>in</strong>novation, po<strong>in</strong>tedto a large gap between smaller <strong>and</strong> larger enterprises. In all categories (strategic, management,organizational, market<strong>in</strong>g <strong>and</strong> product appearance), large enterprises were more successful <strong>in</strong>implement<strong>in</strong>g significant change. In particular, <strong>the</strong> successful <strong>in</strong>novators were more likely to haveforeign capital <strong>and</strong> <strong>in</strong>volvement, provid<strong>in</strong>g <strong>the</strong>m with more opportunities to carry out every k<strong>in</strong>d ofchange to raise <strong>the</strong> competitiveness of <strong>the</strong> company (Kurik et. al, 2002). Two cases of companies whopromote <strong>in</strong>novation through cooperation with academia can be found below <strong>in</strong> Box 6.In Latvia, as well, a recent survey on <strong>in</strong>novative activities (Central Statistical Bureau of Latvia (2003))has shown that large enterprises were <strong>the</strong> most active <strong>in</strong> <strong>in</strong>troduc<strong>in</strong>g technological <strong>in</strong>novations. Largeenterprises had <strong>the</strong> greatest density of <strong>in</strong>novative enterprises, <strong>in</strong> both products <strong>and</strong> processes, acrossmanufactur<strong>in</strong>g <strong>and</strong> service sectors. The survey also identified <strong>the</strong> ma<strong>in</strong> factors hamper<strong>in</strong>g <strong>in</strong>novativeactivity across all enterprises as be<strong>in</strong>g (<strong>in</strong> order of importance): lack of appropriate sources of f<strong>in</strong>ance,<strong>in</strong>novation costs too high, <strong>and</strong> excessive perceived economic risks.These primary barriers are <strong>the</strong> same with<strong>in</strong> European countries (see Table 14). SME survey data<strong>in</strong> Estonia, Latvia <strong>and</strong> Pol<strong>and</strong> confirms this, list<strong>in</strong>g <strong>the</strong> primary constra<strong>in</strong>t to <strong>in</strong>novation as be<strong>in</strong>ghigh costs/availability of f<strong>in</strong>ancial means (Jürgenson et.al. (2003), Central Statistical Bureau ofLatvia (2003), PAED (2003)). When broken down by enterprise size class, it becomes apparent that<strong>the</strong> smaller <strong>the</strong> enterprise, <strong>the</strong> more it has problems with f<strong>in</strong>ancial means; whereas <strong>the</strong> larger <strong>the</strong>enterprise, <strong>the</strong> more o<strong>the</strong>r barriers (e.g. skills of employees, f<strong>in</strong>d<strong>in</strong>g a market for products/services,etc.) have a higher relative importance (Jürgenson et.al. (2003)).51
- Page 1 and 2: Sylvia Schwaag SergerEmily HanssonC
- Page 4 and 5: About the International Organisatio
- Page 7: PREFACEAccession to the Single Mark
- Page 10 and 11: enterprise development. There are n
- Page 12 and 13: BOXESBox 1: The ‘Knowledge-Based
- Page 15 and 16: INTRODUCTIONAfter more than 10 year
- Page 17 and 18: CHAPTER 1: FROM STABILISATION TO IN
- Page 19: increased competitive pressure as B
- Page 22 and 23: Box 2: On Innovation and Innovation
- Page 24 and 25: Table 5: GDP Growth 1995-2003 in Se
- Page 26 and 27: Table 7: Relative Strengths and Wea
- Page 28 and 29: Box 3: The Indicator ProblemExistin
- Page 31 and 32: CHAPTER 2:BALTIC SMEs - AGENTS OF F
- Page 33 and 34: Table 9: Average Annual Growth of S
- Page 35 and 36: Box 4: Overview of Selected Multina
- Page 37 and 38: The Role of SMEs in Transitional Ec
- Page 39 and 40: e to the potential advantage of the
- Page 41 and 42: A common measurement of business ac
- Page 43 and 44: Figure 8: Labour Productivity per P
- Page 45 and 46: Figure 10: Employment in Med/Hi-tec
- Page 47 and 48: Summing up, there are fewer economi
- Page 49 and 50: Overall, SMEs tend to lack the fina
- Page 51: Figure 12: Enterprises with Innovat
- Page 55 and 56: Table 14: Barriers to Innovation fo
- Page 57 and 58: Some interesting examples of cluste
- Page 59 and 60: CHAPTER 3:POLICIES PROMOTING SMEs A
- Page 61 and 62: National governments themselves wil
- Page 63 and 64: Institutional StructureIn all of th
- Page 65 and 66: EU countries (innovation relay cent
- Page 67 and 68: LITHUANIAAgency/OrganisationLithuan
- Page 69 and 70: From the private sector, the chambe
- Page 71 and 72: On the whole, the B4 have relativel
- Page 73 and 74: LITHUANIAProgramme/Policy DocumentI
- Page 75 and 76: Table 19: B4 National Rankings of A
- Page 77 and 78: Box 11: Structural Funds to the Can
- Page 79 and 80: Box 12: On SMEs and FinancingIt doe
- Page 81 and 82: examples of evaluations of national
- Page 83 and 84: CHAPTER 4:CHALLENGES AND RECOMMENDA
- Page 85 and 86: General challengesBased on our own
- Page 87 and 88: the above-mentioned channels. 27 On
- Page 89 and 90: the EU average and particularly wit
- Page 91 and 92: RecommendationsBased on the challen
- Page 93 and 94: CHAPTER 5:A VISION OF A NORDIC-BALT
- Page 95 and 96: addition, they are the most advance
- Page 97 and 98: countries. One such sign is the rap
- Page 99 and 100: CONCLUSIONSEU accession will not re
- Page 101 and 102: REFERENCESAlfonso, Antonio, Ludger
- Page 103 and 104:
European Commission (2003f), Compre
- Page 105 and 106:
Eurostat (2004a), SMEs in the Candi
- Page 107 and 108:
Statistical Office of Estonia (2004
- Page 109 and 110:
APPENDIX I:Agenda for Working Group
- Page 111 and 112:
DAY 2:POLICY SOLUTIONS9:30-10:30 In
- Page 113 and 114:
APPENDIX II:Participants in the IKE
- Page 115 and 116:
APPENDIX III:Conclusions from the I
- Page 117 and 118:
APPENDIX IV:Summary of the Panel se
- Page 119 and 120:
Regarding the role of policymaking,
- Page 121 and 122:
APPENDIX V:Description of Field Stu
- Page 123 and 124:
Mr. Miroslaw MarekMr. Talis Millers
- Page 126:
IKED - International Organisation f