Competing in the Single Market - SMEs and ... - Erhvervsstyrelsen
Competing in the Single Market - SMEs and ... - Erhvervsstyrelsen
Competing in the Single Market - SMEs and ... - Erhvervsstyrelsen

You also want an ePaper? Increase the reach of your titles
YUMPU automatically turns print PDFs into web optimized ePapers that Google loves.
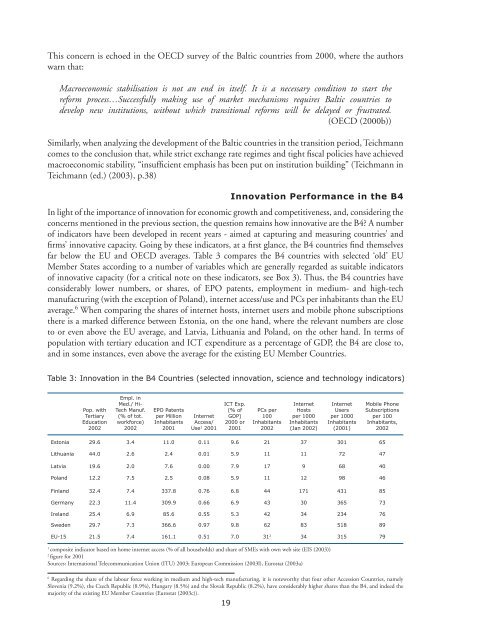
This concern is echoed <strong>in</strong> <strong>the</strong> OECD survey of <strong>the</strong> Baltic countries from 2000, where <strong>the</strong> authorswarn that:Macroeconomic stabilisation is not an end <strong>in</strong> itself. It is a necessary condition to start <strong>the</strong>reform process…Successfully mak<strong>in</strong>g use of market mechanisms requires Baltic countries todevelop new <strong>in</strong>stitutions, without which transitional reforms will be delayed or frustrated.(OECD (2000b))Similarly, when analyz<strong>in</strong>g <strong>the</strong> development of <strong>the</strong> Baltic countries <strong>in</strong> <strong>the</strong> transition period, Teichmanncomes to <strong>the</strong> conclusion that, while strict exchange rate regimes <strong>and</strong> tight fiscal policies have achievedmacroeconomic stability, “<strong>in</strong>sufficient emphasis has been put on <strong>in</strong>stitution build<strong>in</strong>g” (Teichmann <strong>in</strong>Teichmann (ed.) (2003), p.38)Innovation Performance <strong>in</strong> <strong>the</strong> B4In light of <strong>the</strong> importance of <strong>in</strong>novation for economic growth <strong>and</strong> competitiveness, <strong>and</strong>, consider<strong>in</strong>g <strong>the</strong>concerns mentioned <strong>in</strong> <strong>the</strong> previous section, <strong>the</strong> question rema<strong>in</strong>s how <strong>in</strong>novative are <strong>the</strong> B4? A numberof <strong>in</strong>dicators have been developed <strong>in</strong> recent years - aimed at captur<strong>in</strong>g <strong>and</strong> measur<strong>in</strong>g countries’ <strong>and</strong>firms’ <strong>in</strong>novative capacity. Go<strong>in</strong>g by <strong>the</strong>se <strong>in</strong>dicators, at a first glance, <strong>the</strong> B4 countries f<strong>in</strong>d <strong>the</strong>mselvesfar below <strong>the</strong> EU <strong>and</strong> OECD averages. Table 3 compares <strong>the</strong> B4 countries with selected ‘old’ EUMember States accord<strong>in</strong>g to a number of variables which are generally regarded as suitable <strong>in</strong>dicatorsof <strong>in</strong>novative capacity (for a critical note on <strong>the</strong>se <strong>in</strong>dicators, see Box 3). Thus, <strong>the</strong> B4 countries haveconsiderably lower numbers, or shares, of EPO patents, employment <strong>in</strong> medium- <strong>and</strong> high-techmanufactur<strong>in</strong>g (with <strong>the</strong> exception of Pol<strong>and</strong>), <strong>in</strong>ternet access/use <strong>and</strong> PCs per <strong>in</strong>habitants than <strong>the</strong> EUaverage. 6 When compar<strong>in</strong>g <strong>the</strong> shares of <strong>in</strong>ternet hosts, <strong>in</strong>ternet users <strong>and</strong> mobile phone subscriptions<strong>the</strong>re is a marked difference between Estonia, on <strong>the</strong> one h<strong>and</strong>, where <strong>the</strong> relevant numbers are closeto or even above <strong>the</strong> EU average, <strong>and</strong> Latvia, Lithuania <strong>and</strong> Pol<strong>and</strong>, on <strong>the</strong> o<strong>the</strong>r h<strong>and</strong>. In terms ofpopulation with tertiary education <strong>and</strong> ICT expenditure as a percentage of GDP, <strong>the</strong> B4 are close to,<strong>and</strong> <strong>in</strong> some <strong>in</strong>stances, even above <strong>the</strong> average for <strong>the</strong> exist<strong>in</strong>g EU Member Countries.Table 3: Innovation <strong>in</strong> <strong>the</strong> B4 Countries (selected <strong>in</strong>novation, science <strong>and</strong> technology <strong>in</strong>dicators)Pop. withTertiaryEducation2002Empl. <strong>in</strong>Med./ Hi-Tech Manuf.(% of tot.workforce)2002EPO Patentsper MillionInhabitants2001InternetAccess/Use 1 2001ICT Exp.(% ofGDP)2000 or2001PCs per100Inhabitants2002InternetHostsper 1000Inhabitants(Jan 2002)InternetUsersper 1000Inhabitants(2001)Mobile PhoneSubscriptionsper 100Inhabitants,2002Estonia 29.6 3.4 11.0 0.11 9.6 21 37 301 65Lithuania 44.0 2.6 2.4 0.01 5.9 11 11 72 47Latvia 19.6 2.0 7.6 0.00 7.9 17 9 68 40Pol<strong>and</strong> 12.2 7.5 2.5 0.08 5.9 11 12 98 46F<strong>in</strong>l<strong>and</strong> 32.4 7.4 337.8 0.76 6.8 44 171 431 85Germany 22.3 11.4 309.9 0.66 6.9 43 30 365 73Irel<strong>and</strong> 25.4 6.9 85.6 0.55 5.3 42 34 234 76Sweden 29.7 7.3 366.6 0.97 9.8 62 83 518 89EU-15 21.5 7.4 161.1 0.51 7.0 31 2 34 315 791composite <strong>in</strong>dicator based on home <strong>in</strong>ternet access (% of all households) <strong>and</strong> share of <strong>SMEs</strong> with own web site (EIS (2003))2figure for 2001Sources: International Telecommunication Union (ITU) 2003; European Commission (2003l), Eurostat (2003a)6Regard<strong>in</strong>g <strong>the</strong> share of <strong>the</strong> labour force work<strong>in</strong>g <strong>in</strong> medium <strong>and</strong> high-tech manufactur<strong>in</strong>g, it is noteworthy that four o<strong>the</strong>r Accession Countries, namelySlovenia (9.2%), <strong>the</strong> Czech Republic (8.9%), Hungary (8.5%) <strong>and</strong> <strong>the</strong> Slovak Republic (8.2%), have considerably higher shares than <strong>the</strong> B4, <strong>and</strong> <strong>in</strong>deed <strong>the</strong>majority of <strong>the</strong> exist<strong>in</strong>g EU Member Countries (Eurostat (2003c)).19