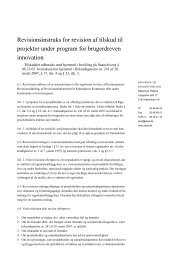
Figure 9: Structure of Gross Value-Added by Sector 19 , Trends for B4 Countries100%90%80%70%60%50%40%30%20%10%0%ESTONIAStructure of Gross Value-Added by Sector(% of total, by NACE classification)31,8 32,8 33,6 32,91999 2000 2001 2002100%90%80%70%60%50%40%30%20%10%0%LATVIAStructure of Gross Value-Added by Sector(% of total, by NACE classification)31 32,4 32,8 31,41999 2000 2001 2002Services Agricultural Industry Construction Trade O<strong>the</strong>r ActivitiesServices Agricultural Industry Construction Trade O<strong>the</strong>r Activities100%90%80%70%60%50%40%30%20%10%0%LITHUANIAStructure of Gross Value-Added by Sector(% of total, by NACE classification)23 24,7 24,8 261999 2000 2001 2002100%90%80%70%60%50%40%30%20%10%0%POLANDStructure of Gross Value-Added by Sector(% of total, by NACE classification)22,1 22,8 23,9 24,31999 2000 2001 2002Services Agricultural Industry Construction Trade O<strong>the</strong>r ActivitiesServices Agricultural Industry Construction Trade O<strong>the</strong>r ActivitiesSource: Romanian National Institute of Statistics, (2003)<strong>SMEs</strong> are most prom<strong>in</strong>ent with<strong>in</strong> <strong>the</strong> trade sector, although lately <strong>the</strong>ir presence <strong>the</strong>re has beenshr<strong>in</strong>k<strong>in</strong>g (Figure 11). Without more detailed data <strong>and</strong> careful exam<strong>in</strong>ation, it is difficult to drawconclusions as to <strong>the</strong> implications of <strong>the</strong> sectoral make-up of <strong>SMEs</strong> <strong>in</strong> <strong>the</strong> B4. In considerationof <strong>the</strong> fact that employment <strong>in</strong> <strong>the</strong> B4 countries is, on average, less high-tech <strong>in</strong>tensive <strong>in</strong> bothmanufactur<strong>in</strong>g <strong>and</strong> services than <strong>in</strong> <strong>the</strong> EU (see Figure 10), an exclusive high-tech focus would clearlybe <strong>in</strong>appropriate. One of <strong>the</strong> big challenges <strong>in</strong> policymak<strong>in</strong>g is <strong>the</strong> question of whe<strong>the</strong>r it is possibleto gauge <strong>in</strong> which areas <strong>the</strong> development potential of <strong>SMEs</strong> would be <strong>the</strong> greatest or, even morespecifically, <strong>in</strong> which area support of <strong>SMEs</strong> might render <strong>the</strong> greatest social benefits.19For comparison purposes, sectors have been def<strong>in</strong>ed us<strong>in</strong>g <strong>the</strong> follow<strong>in</strong>g NACE classification group<strong>in</strong>gs: Agricultural (A,B), Industry (C,D,E), Construction(F), Trade (G), Services (H,I,J,K), O<strong>the</strong>r Activities (L,M,N,O,P,Q).42
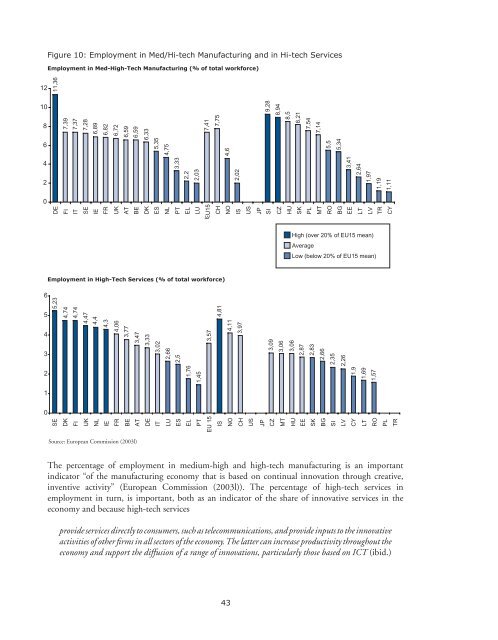
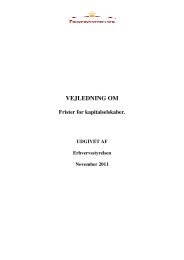
Figure 10: Employment <strong>in</strong> Med/Hi-tech Manufactur<strong>in</strong>g <strong>and</strong> <strong>in</strong> Hi-tech ServicesEmployment <strong>in</strong> Med-High-Tech Manufactur<strong>in</strong>g (% of total workforce)1210864206Employment <strong>in</strong> High-Tech Services (% of total workforce)543210Source: European Commission (2003l)The percentage of employment <strong>in</strong> medium-high <strong>and</strong> high-tech manufactur<strong>in</strong>g is an important<strong>in</strong>dicator “of <strong>the</strong> manufactur<strong>in</strong>g economy that is based on cont<strong>in</strong>ual <strong>in</strong>novation through creative,<strong>in</strong>ventive activity” (European Commission (2003l)). The percentage of high-tech services <strong>in</strong>employment <strong>in</strong> turn, is important, both as an <strong>in</strong>dicator of <strong>the</strong> share of <strong>in</strong>novative services <strong>in</strong> <strong>the</strong>economy <strong>and</strong> because high-tech servicesprovide services directly to consumers, such as telecommunications, <strong>and</strong> provide <strong>in</strong>puts to <strong>the</strong> <strong>in</strong>novativeactivities of o<strong>the</strong>r firms <strong>in</strong> all sectors of <strong>the</strong> economy. The latter can <strong>in</strong>crease productivity throughout <strong>the</strong>economy <strong>and</strong> support <strong>the</strong> diffusion of a range of <strong>in</strong>novations, particularly those based on ICT (ibid.)43
- Page 1 and 2: Sylvia Schwaag SergerEmily HanssonC
- Page 4 and 5: About the International Organisatio
- Page 7: PREFACEAccession to the Single Mark
- Page 10 and 11: enterprise development. There are n
- Page 12 and 13: BOXESBox 1: The ‘Knowledge-Based
- Page 15 and 16: INTRODUCTIONAfter more than 10 year
- Page 17 and 18: CHAPTER 1: FROM STABILISATION TO IN
- Page 19: increased competitive pressure as B
- Page 22 and 23: Box 2: On Innovation and Innovation
- Page 24 and 25: Table 5: GDP Growth 1995-2003 in Se
- Page 26 and 27: Table 7: Relative Strengths and Wea
- Page 28 and 29: Box 3: The Indicator ProblemExistin
- Page 31 and 32: CHAPTER 2:BALTIC SMEs - AGENTS OF F
- Page 33 and 34: Table 9: Average Annual Growth of S
- Page 35 and 36: Box 4: Overview of Selected Multina
- Page 37 and 38: The Role of SMEs in Transitional Ec
- Page 39 and 40: e to the potential advantage of the
- Page 41 and 42: A common measurement of business ac
- Page 43: Figure 8: Labour Productivity per P
- Page 47 and 48: Summing up, there are fewer economi
- Page 49 and 50: Overall, SMEs tend to lack the fina
- Page 51 and 52: Figure 12: Enterprises with Innovat
- Page 53 and 54: Figure 14: Proportion of Enterprise
- Page 55 and 56: Table 14: Barriers to Innovation fo
- Page 57 and 58: Some interesting examples of cluste
- Page 59 and 60: CHAPTER 3:POLICIES PROMOTING SMEs A
- Page 61 and 62: National governments themselves wil
- Page 63 and 64: Institutional StructureIn all of th
- Page 65 and 66: EU countries (innovation relay cent
- Page 67 and 68: LITHUANIAAgency/OrganisationLithuan
- Page 69 and 70: From the private sector, the chambe
- Page 71 and 72: On the whole, the B4 have relativel
- Page 73 and 74: LITHUANIAProgramme/Policy DocumentI
- Page 75 and 76: Table 19: B4 National Rankings of A
- Page 77 and 78: Box 11: Structural Funds to the Can
- Page 79 and 80: Box 12: On SMEs and FinancingIt doe
- Page 81 and 82: examples of evaluations of national
- Page 83 and 84: CHAPTER 4:CHALLENGES AND RECOMMENDA
- Page 85 and 86: General challengesBased on our own
- Page 87 and 88: the above-mentioned channels. 27 On
- Page 89 and 90: the EU average and particularly wit
- Page 91 and 92: RecommendationsBased on the challen
- Page 93 and 94: CHAPTER 5:A VISION OF A NORDIC-BALT
- Page 95 and 96:
addition, they are the most advance
- Page 97 and 98:
countries. One such sign is the rap
- Page 99 and 100:
CONCLUSIONSEU accession will not re
- Page 101 and 102:
REFERENCESAlfonso, Antonio, Ludger
- Page 103 and 104:
European Commission (2003f), Compre
- Page 105 and 106:
Eurostat (2004a), SMEs in the Candi
- Page 107 and 108:
Statistical Office of Estonia (2004
- Page 109 and 110:
APPENDIX I:Agenda for Working Group
- Page 111 and 112:
DAY 2:POLICY SOLUTIONS9:30-10:30 In
- Page 113 and 114:
APPENDIX II:Participants in the IKE
- Page 115 and 116:
APPENDIX III:Conclusions from the I
- Page 117 and 118:
APPENDIX IV:Summary of the Panel se
- Page 119 and 120:
Regarding the role of policymaking,
- Page 121 and 122:
APPENDIX V:Description of Field Stu
- Page 123 and 124:
Mr. Miroslaw MarekMr. Talis Millers
- Page 126:
IKED - International Organisation f