Box 2: On Innovation <strong>and</strong> Innovation SystemsThe European Commission def<strong>in</strong>es <strong>in</strong>novation as “<strong>the</strong> renewal <strong>and</strong> enlargement of <strong>the</strong> rangeof products <strong>and</strong> services <strong>and</strong> <strong>the</strong> associated markets; <strong>the</strong> establishment of new methods ofproduction, supply <strong>and</strong> distribution; <strong>the</strong> <strong>in</strong>troduction of changes <strong>in</strong> management, workorganisation, <strong>and</strong> <strong>the</strong> work<strong>in</strong>g conditions <strong>and</strong> skills of <strong>the</strong> workforce” (European Commission(COM(1995) 688). Traditional perspectives have viewed <strong>in</strong>novation as closely related toscience <strong>and</strong> technology. In practice, however, <strong>in</strong>novation can take many forms, <strong>in</strong>clud<strong>in</strong>gcommercialisation of science <strong>and</strong> technology as well as <strong>the</strong> development <strong>and</strong> implementationof new ideas more generally, as <strong>in</strong> <strong>the</strong> form of organizational change or <strong>in</strong>vent<strong>in</strong>g new ways ofdo<strong>in</strong>g th<strong>in</strong>gs.Ra<strong>the</strong>r than be<strong>in</strong>g a one-dimensional, l<strong>in</strong>ear process lead<strong>in</strong>g from certa<strong>in</strong> <strong>in</strong>put factors,<strong>in</strong>novation is <strong>the</strong> result of efforts by multiple actors, <strong>and</strong> is enhanced by <strong>the</strong>ir constructive<strong>in</strong>teractions. The concept of <strong>in</strong>novation has evolved from a l<strong>in</strong>ear model hav<strong>in</strong>g R&D as <strong>the</strong>start<strong>in</strong>g po<strong>in</strong>t, to <strong>the</strong> systemic model <strong>in</strong> which <strong>in</strong>novation arises from complex <strong>in</strong>teractionsbetween <strong>in</strong>dividuals, organisations <strong>and</strong> <strong>the</strong>ir operat<strong>in</strong>g environment (European Commission2003k). The notion of <strong>in</strong>novation system aims to broaden <strong>the</strong> scope of <strong>the</strong> policymaker toencompass <strong>the</strong> factors <strong>and</strong> reforms that may be most important for free<strong>in</strong>g up <strong>the</strong> potentialfor <strong>in</strong>novation, irrespective of <strong>in</strong> which policy doma<strong>in</strong> <strong>the</strong>y are found. Fur<strong>the</strong>rmore, <strong>the</strong> term‘<strong>in</strong>novation system’ has emerged to capture <strong>the</strong> <strong>in</strong>terrelated role of different actors, markets <strong>and</strong><strong>in</strong>stitutions (Andersson et. al. (2004a), p.19).Based on <strong>the</strong> <strong>in</strong>novation system approach, <strong>in</strong>novation policy is a horizontal policy approachencompass<strong>in</strong>g a wide range of areas <strong>and</strong> <strong>in</strong>struments that cut across traditional policy doma<strong>in</strong>s.Areas that could be mentioned <strong>in</strong> this context are taxation <strong>and</strong> <strong>in</strong>centive structures, ICT access<strong>and</strong> penetration, R&D <strong>in</strong>vestment <strong>and</strong> commercialization, networks <strong>and</strong> cluster<strong>in</strong>g, bus<strong>in</strong>essenvironment, technology upgrad<strong>in</strong>g, foreign direct <strong>in</strong>vestment, education, attitudes <strong>and</strong> socialcapital, etc. (see also figure below).Innovation System ModelDem<strong>and</strong>Consumers (f<strong>in</strong>al dem<strong>and</strong>)Producers (<strong>in</strong>termediate dem<strong>and</strong>)Framework ConditionsF<strong>in</strong>ancial enviroment; taxation <strong>and</strong><strong>in</strong>centives; propensity to <strong>in</strong>novation<strong>and</strong> entrepreneurship; mobilityIndustrialSystemEducation <strong>and</strong>Research SystemPoliticalSystemLarge companiesProffessionaleducation, tra<strong>in</strong><strong>in</strong>gGovernmentMature <strong>SMEs</strong>IntermediariesResearch<strong>in</strong>stitutes;BrokersHigher education<strong>and</strong> researchGovernanceNew, technologybasedfirmsPublic ssectorresearchRTD policiesInfrastructureBank<strong>in</strong>g,venture capitalIPR <strong>and</strong><strong>in</strong>formationInnovation <strong>and</strong>bus<strong>in</strong>ess reportStanards <strong>and</strong>normsSource: Arnold, Kuhlman, van der Meulen (2001)20
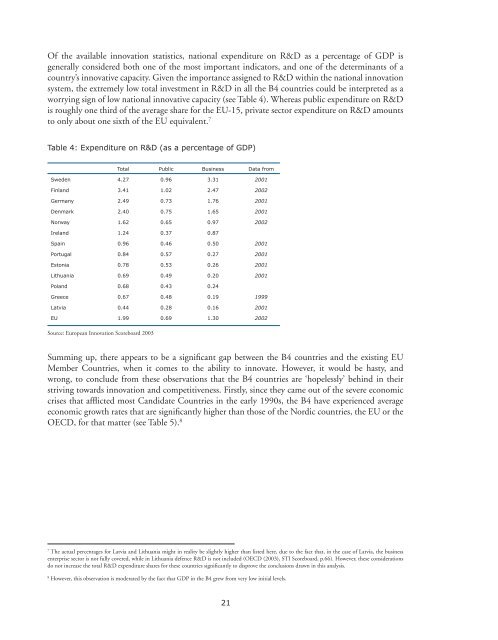
Of <strong>the</strong> available <strong>in</strong>novation statistics, national expenditure on R&D as a percentage of GDP isgenerally considered both one of <strong>the</strong> most important <strong>in</strong>dicators, <strong>and</strong> one of <strong>the</strong> determ<strong>in</strong>ants of acountry’s <strong>in</strong>novative capacity. Given <strong>the</strong> importance assigned to R&D with<strong>in</strong> <strong>the</strong> national <strong>in</strong>novationsystem, <strong>the</strong> extremely low total <strong>in</strong>vestment <strong>in</strong> R&D <strong>in</strong> all <strong>the</strong> B4 countries could be <strong>in</strong>terpreted as aworry<strong>in</strong>g sign of low national <strong>in</strong>novative capacity (see Table 4). Whereas public expenditure on R&Dis roughly one third of <strong>the</strong> average share for <strong>the</strong> EU-15, private sector expenditure on R&D amountsto only about one sixth of <strong>the</strong> EU equivalent. 7Table 4: Expenditure on R&D (as a percentage of GDP)Total Public Bus<strong>in</strong>ess Data fromSweden 4.27 0.96 3.31 2001F<strong>in</strong>l<strong>and</strong> 3.41 1.02 2.47 2002Germany 2.49 0.73 1.76 2001Denmark 2.40 0.75 1.65 2001Norway 1.62 0.65 0.97 2002Irel<strong>and</strong> 1.24 0.37 0.87Spa<strong>in</strong> 0.96 0.46 0.50 2001Portugal 0.84 0.57 0.27 2001Estonia 0.78 0.53 0.26 2001Lithuania 0.69 0.49 0.20 2001Pol<strong>and</strong> 0.68 0.43 0.24Greece 0.67 0.48 0.19 1999Latvia 0.44 0.28 0.16 2001EU 1.99 0.69 1.30 2002Source: European Innovation Scoreboard 2003Summ<strong>in</strong>g up, <strong>the</strong>re appears to be a significant gap between <strong>the</strong> B4 countries <strong>and</strong> <strong>the</strong> exist<strong>in</strong>g EUMember Countries, when it comes to <strong>the</strong> ability to <strong>in</strong>novate. However, it would be hasty, <strong>and</strong>wrong, to conclude from <strong>the</strong>se observations that <strong>the</strong> B4 countries are ‘hopelessly’ beh<strong>in</strong>d <strong>in</strong> <strong>the</strong>irstriv<strong>in</strong>g towards <strong>in</strong>novation <strong>and</strong> competitiveness. Firstly, s<strong>in</strong>ce <strong>the</strong>y came out of <strong>the</strong> severe economiccrises that afflicted most C<strong>and</strong>idate Countries <strong>in</strong> <strong>the</strong> early 1990s, <strong>the</strong> B4 have experienced averageeconomic growth rates that are significantly higher than those of <strong>the</strong> Nordic countries, <strong>the</strong> EU or <strong>the</strong>OECD, for that matter (see Table 5). 87The actual percentages for Latvia <strong>and</strong> Lithuania might <strong>in</strong> reality be slightly higher than listed here, due to <strong>the</strong> fact that, <strong>in</strong> <strong>the</strong> case of Latvia, <strong>the</strong> bus<strong>in</strong>essenterprise sector is not fully covered, while <strong>in</strong> Lithuania defence R&D is not <strong>in</strong>cluded (OECD (2003), STI Scoreboard, p.66). However, <strong>the</strong>se considerationsdo not <strong>in</strong>crease <strong>the</strong> total R&D expenditure shares for <strong>the</strong>se countries significantly to disprove <strong>the</strong> conclusions drawn <strong>in</strong> this analysis.8However, this observation is moderated by <strong>the</strong> fact that GDP <strong>in</strong> <strong>the</strong> B4 grew from very low <strong>in</strong>itial levels.21
- Page 1 and 2: Sylvia Schwaag SergerEmily HanssonC
- Page 4 and 5: About the International Organisatio
- Page 7: PREFACEAccession to the Single Mark
- Page 10 and 11: enterprise development. There are n
- Page 12 and 13: BOXESBox 1: The ‘Knowledge-Based
- Page 15 and 16: INTRODUCTIONAfter more than 10 year
- Page 17 and 18: CHAPTER 1: FROM STABILISATION TO IN
- Page 19: increased competitive pressure as B
- Page 24 and 25: Table 5: GDP Growth 1995-2003 in Se
- Page 26 and 27: Table 7: Relative Strengths and Wea
- Page 28 and 29: Box 3: The Indicator ProblemExistin
- Page 31 and 32: CHAPTER 2:BALTIC SMEs - AGENTS OF F
- Page 33 and 34: Table 9: Average Annual Growth of S
- Page 35 and 36: Box 4: Overview of Selected Multina
- Page 37 and 38: The Role of SMEs in Transitional Ec
- Page 39 and 40: e to the potential advantage of the
- Page 41 and 42: A common measurement of business ac
- Page 43 and 44: Figure 8: Labour Productivity per P
- Page 45 and 46: Figure 10: Employment in Med/Hi-tec
- Page 47 and 48: Summing up, there are fewer economi
- Page 49 and 50: Overall, SMEs tend to lack the fina
- Page 51 and 52: Figure 12: Enterprises with Innovat
- Page 53 and 54: Figure 14: Proportion of Enterprise
- Page 55 and 56: Table 14: Barriers to Innovation fo
- Page 57 and 58: Some interesting examples of cluste
- Page 59 and 60: CHAPTER 3:POLICIES PROMOTING SMEs A
- Page 61 and 62: National governments themselves wil
- Page 63 and 64: Institutional StructureIn all of th
- Page 65 and 66: EU countries (innovation relay cent
- Page 67 and 68: LITHUANIAAgency/OrganisationLithuan
- Page 69 and 70: From the private sector, the chambe
- Page 71 and 72: On the whole, the B4 have relativel
- Page 73 and 74:
LITHUANIAProgramme/Policy DocumentI
- Page 75 and 76:
Table 19: B4 National Rankings of A
- Page 77 and 78:
Box 11: Structural Funds to the Can
- Page 79 and 80:
Box 12: On SMEs and FinancingIt doe
- Page 81 and 82:
examples of evaluations of national
- Page 83 and 84:
CHAPTER 4:CHALLENGES AND RECOMMENDA
- Page 85 and 86:
General challengesBased on our own
- Page 87 and 88:
the above-mentioned channels. 27 On
- Page 89 and 90:
the EU average and particularly wit
- Page 91 and 92:
RecommendationsBased on the challen
- Page 93 and 94:
CHAPTER 5:A VISION OF A NORDIC-BALT
- Page 95 and 96:
addition, they are the most advance
- Page 97 and 98:
countries. One such sign is the rap
- Page 99 and 100:
CONCLUSIONSEU accession will not re
- Page 101 and 102:
REFERENCESAlfonso, Antonio, Ludger
- Page 103 and 104:
European Commission (2003f), Compre
- Page 105 and 106:
Eurostat (2004a), SMEs in the Candi
- Page 107 and 108:
Statistical Office of Estonia (2004
- Page 109 and 110:
APPENDIX I:Agenda for Working Group
- Page 111 and 112:
DAY 2:POLICY SOLUTIONS9:30-10:30 In
- Page 113 and 114:
APPENDIX II:Participants in the IKE
- Page 115 and 116:
APPENDIX III:Conclusions from the I
- Page 117 and 118:
APPENDIX IV:Summary of the Panel se
- Page 119 and 120:
Regarding the role of policymaking,
- Page 121 and 122:
APPENDIX V:Description of Field Stu
- Page 123 and 124:
Mr. Miroslaw MarekMr. Talis Millers
- Page 126:
IKED - International Organisation f