<strong>Municipal</strong> <strong>Study</strong> <strong>2011</strong>SingleDetachedDwellingsper unitWoolwich 18,113Huntsville 18,901Niagara Falls 19,182Grimsby 19,281Bracebridge 19,415Fort Erie 19,662Wilmot 19,998Penetanguishene 21,112Gravenhurst 21,186Orangeville 22,203London 22,599Kitchener 23,149Lincoln 23,623The Blue Mountains 23,630Cambridge 25,311Guelph 25,615Waterloo 27,730Hamilton 27,752Barrie 28,377Oshawa 29,109Innisfil 29,813Pickering 31,918Whitby 32,893Ajax 33,874Mississauga 35,265Clarington 35,893Burlington 36,371Caledon 37,967Georgina 38,262Halton Hills 42,418Brampton 43,129East Gwillimbury 44,921Milton 45,143King 45,299Richmond Hill 45,433Whitchurch-Stouffville 46,010Vaughan 46,242Oakville 47,249Newmarket 47,339Aurora 48,798Markham 52,892Average 22,496Median 19,232Minimum 2,641Maximum 52,892<strong>2011</strong> Total Development Charges (cont’d)MultiplesDwelling 3+per unitMultiplesDwelling1&2 per unitApartmentunits < 2per unitApartmentunits >=2per unitNonResidentialCommercialper sq. ft.NonResidentialIndustrialper sq. ft.$$$$$$$$$$$ $ 13,625 $ 13,625 $ 10,775 $ 11,403 $ 11.42 11.42$ $ 16,676 $ 16,676 $ 8,571 $ 13,202 $ 3.62 2.55$ $ 13,096 $ 13,096 $ 10,847 $ 10,847 $ 13.06 6.67$ $ 13,410 $ 13,410 $ 9,415 $ 11,555 $ 13.30 6.91$ $ 17,079 $ 17,079 $ 8,653 $ 12,812 $ 7.67 7.67$ $ 16,940 $ 15,403 $ 9,750 $ 15,623 $ 15.95 9.56$ $ 15,326 $ 15,326 $ 11,612 $ 13,856 $ 12.86 11.34$ $ 16,382 $ 16,382 $ 14,537 $ 14,537 $ 2.92 2.92$ $ 14,750 $ 19,016 $ 9,456 $ 14,352 $ 5.29 5.29$ $ 18,619 $ 18,619 $ 9,217 $ 12,904 $ 7.80 7.80$ $ 16,317 $ 16,317 $ 9,835 $ 13,630 $ 15.19 none$ $ 16,615 $ 16,615 $ 13,978 $ 13,978 $ 14.27 $ 14.27$ $ 16,925 $ 16,925 $ 11,451 $ 14,619 $ 16.12 $ 9.73$ $ 23,630 $ 23,630 none none $ 11.40 $ 11.40$ $ 21,586 $ 21,586 $ 15,813 $ 15,813 $ 11.90 $ 11.90$ $ 19,933 $ 19,933 $ 12,259 $ 16,448 $ 11.72 $ 5.79$ $ 19,847 $ 19,847 $ 15,196 $ 17,107 $ 15.04 $ 15.04$ $ 20,064 $ 20,064 $ 11,793 $ 17,369 $ 19.18 $ 7.02$ $ 24,768 $ 24,768 $ 14,524 $ 17,042 $ 16.53 $ 10.70$ $ 23,857 $ 23,857 $ 12,118 $ 18,780 $ 21.41 $ 4.75$ $ 26,844 $ 26,844 $ 15,766 $ 19,071 $ 10.79 $ 10.79$ $ 25,499 $ 25,499 $ 13,256 $ 19,046 $ 22.41 $ 8.66$ $ 27,389 $ 27,389 $ 13,497 $ 21,312 $ 18.50 $ 4.75$ $ 27,661 $ 27,661 $ 13,632 $ 20,222 $ 21.90 $ 8.15$ $ 35,265 $ 35,265 $ 14,672 $ 26,591 $ 14.95 $ 11.28$ $ 30,353 $ 23,989 $ 14,886 $ 22,942 $ 24.07 $ 7.58$ $ 28,833 $ 22,085 $ 16,373 $ 21,822 $ 20.86 $ 16.29$ $ 33,866 $ 33,866 $ 15,582 $ 26,724 $ 13.30 $ 10.77$ $ 32,595 $ 32,595 $ 16,916 $ 24,882 $ 38.72 $ 16.03$ $ 34,828 $ 24,820 $ 18,087 $ 24,592 $ 18.93 $ 15.35$ $ 39,019 $ 39,019 $ 17,208 $ 14,359 $ 13.21 $ 10.68$ $ 37,514 $ 37,514 $ 19,282 $ 28,284 $ 30.24 $ 17.55$ $ 36,134 $ 36,134 $ 19,933 $ 28,105 $ 22.22 $ 19.92$ $ 38,090 $ 38,090 $ 19,322 $ 28,356 $ 31.15 $ 18.46$ $ 37,726 $ 37,726 $ 19,798 $ 28,849 $ 30.99 $ 20.61$ $ 37,905 $ 37,905 $ 20,635 $ 29,928 $ 36.42 $ 17.72$ $ 38,840 $ 38,840 $ 22,160 $ 29,214 $ 29.09 $ 16.40$ $ 37,502 $ 31,882 $ 20,003 $ 29,697 $ 19.52 $ 19.52$ $ 38,115 $ 29,159 $ 18,780 $ 27,692 $ 28.90 $ 16.21$ $ 40,136 $ 40,136 $ 21,622 $ 30,916 $ 29.56 $ 16.87$ $ 43,326 $ 43,326 $ 21,915 $ 33,631 $ 28.11 $ 15.35$ $ 18,068 $ 17,608 $ 10,502 $ 13,970 $ 12.89 $ 8.43$ $ 14,279 $ 14,567 $ 9,415 $ 11,555 $ 11.72 $ 7.33$ $ 1,954 $ 1,954 $ 1,069 $ 1,649 $ 0.88 $ 0.40$ $ 43,326 $ 43,326 $ 22,160 $ 33,631 $ 38.72 $ 20.61User Fees & Revenue Information164
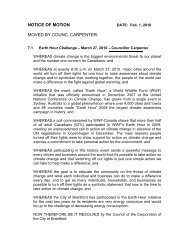
<strong>2011</strong> Development Charges—Grouped by LocationSingleDetachedDwellingsper unitMultiplesDwelling3+ per unitNorth OntarioMultiplesDwelling 1&2per unitApartmentunits < 2per unitSimcoe/Muskoka/Dufferin AreaApartmentunits >=2per unit<strong>Municipal</strong> <strong>Study</strong> <strong>2011</strong>NonResidentialCommercialper sq. ft.NonResidentialIndustrial persq. ft.Fort Frances none none none none none none noneKenora none none none none none none noneSault Ste. Marie none none none none none none noneSeguin none none none none none none noneThunder Bay none none none none none none noneTimmins none none none none none none noneNorth Bay $ 6,160 $ 5,082 $ 5,082 $ 2,938 $ 2,938 $ 1.82 $ 1.82Greater Sudbury $ 11,597 $ 7,243 $ 7,243 $ 7,243 $ 7,243 $ 7.36 $ 3.16North Average $ 8,879 $ 6,163 $ 6,163 $ 5,091 $ 5,091 $ 4.59 $ 2.49SingleDetachedDwellingsper unitHuntsville 18,901Bracebridge 19,415Penetanguishene 21,112Gravenhurst 21,186Orangeville 22,203Barrie 28,377Innisfil 29,813MultiplesDwelling3+ per unitMultiplesDwelling1&2 perunitApartmentunits < 2per unitApartmentunits >=2per unitNonResidentialCommercialper sq. ft.NonResidentialIndustrial persq. ft.$ $ 16,676 $ 16,676 $ 8,571 $ 13,202 $ 3.62 $ 2.55$ $ 17,079 $ 17,079 $ 8,653 $ 12,812 $ 7.67 $ 7.67$ $ 16,382 $ 16,382 $ 14,537 $ 14,537 $ 2.92 $ 2.92$ $ 14,750 $ 19,016 $ 9,456 $ 14,352 $ 5.29 $ 5.29$ $ 18,619 $ 18,619 $ 9,217 $ 12,904 $ 7.80 $ 7.80$ $ 24,768 $ 24,768 $ 14,524 $ 17,042 $ 16.53 $ 10.70$ $ 26,844 $ 26,844 $ 15,766 $ 19,071 $ 10.79 $ 10.79Simcoe/Musk./Duff. Avg. $ 23,001 $ 19,303 $ 19,912 $ 11,532 $ 14,846 $ 7.80 $ 6.82SingleDetachedDwellingsper unitSt. Catharines 9,090Pelham 15,400Thorold 15,413Welland 15,605Wainfleet 15,804West Lincoln 15,946Port Colborne 17,025Niagara-on-the-Lake 17,779Niagara Falls 19,182Grimsby 19,281Fort Erie 19,662Lincoln 23,623Hamilton 27,752Niagara/HamiltonMultiples Multiples ApartmentDwelling Dwelling 1&2 units < 23+ per unit per unit per unitApartmentunits >=2per unitNonResidentialCommercialper sq. ft.NonResidentialIndustrial persq. ft.$ $ 6,368 $ 6,368 $ 5,356 $ 5,356 $ 8.59 $ 2.20$ $ 10,920 $ 10,920 $ 7,963 $ 9,328 $ 8.59 $ 2.20$ $ 10,733 $ 10,733 $ 8,085 $ 8,908 $ 11.37 $ 4.98$ $ 11,449 $ 11,449 $ 8,227 $ 9,729 $ 12.85 $ 6.46$ $ 10,872 $ 10,872 $ 7,956 $ 9,307 $ 12.55 $ 6.16$ $ 10,547 $ 10,547 $ 7,767 $ 9,021 $ 11.14 $ 4.75$ $ 11,875 $ 11,875 $ 8,536 $ 10,188 $ 11.56 $ 3.49$ $ 13,169 $ 13,169 $ 9,226 $ 11,265 $ 13.20 $ 6.81$ $ 13,096 $ 13,096 $ 10,847 $ 10,847 $ 13.06 $ 6.67$ $ 13,410 $ 13,410 $ 9,415 $ 11,555 $ 13.30 $ 6.91$ $ 16,940 $ 15,403 $ 9,750 $ 15,623 $ 15.95 $ 9.56$ $ 16,925 $ 16,925 $ 11,451 $ 14,619 $ 16.12 $ 9.73$ $ 20,064 $ 20,064 $ 11,793 $ 17,369 $ 19.18 $ 7.02Niagara/Ham. Average $ 17,812 $ 12,798 $ 12,679 $ 8,952 $ 11,009 $ 12.88 $ 5.92User Fees & Revenue Information165
- Page 5 and 6:
Municipal Study 2011Executive Summa
- Page 7 and 8:
Municipal Study 2011BrantfordSurvey
- Page 9 and 10:
Municipal Study 20112011 Comparison
- Page 11 and 12:
Municipal Study 2011SECTION 1: Intr
- Page 13 and 14:
Municipal Study 2011Age and Conditi
- Page 15 and 16:
Municipal Study 2011Asset Consumpti
- Page 17 and 18:
Municipal Study 2011Net municipal l
- Page 19 and 20:
Municipal Study 2011SECTION 7: Comp
- Page 21 and 22:
Municipal Study 2011SECTION 8: Comp
- Page 23 and 24:
Municipal Study 2011Introduction1
- Page 25 and 26:
Municipal Study 2011Municipal Study
- Page 27 and 28:
Municipal Study 2011Municipalities
- Page 29 and 30:
Municipal Study 2011Socio Economic
- Page 31 and 32:
Municipal Study 2011Population Stat
- Page 33 and 34:
Municipal Study 2011Simcoe/Muskoka/
- Page 35 and 36:
Municipal Study 2011Niagara/Hamilto
- Page 37 and 38:
Municipal Study 2011Northern——%
- Page 39 and 40:
Municipal Study 2011Ontario Populat
- Page 41 and 42:
Municipal Study 2011Age Demographic
- Page 43 and 44:
Municipal Study 2011% of Dwellings
- Page 45 and 46:
Municipal Study 2011Average Househo
- Page 47 and 48:
Municipal Study 2011Land Area and D
- Page 49 and 50:
Municipal Study 2011Land Area and D
- Page 51 and 52:
Municipal Study 2011Assessment Per
- Page 53 and 54:
Municipal Study 2011Taxable Assessm
- Page 55 and 56:
Municipal Study 2011Unweighted Asse
- Page 57 and 58:
Unweighted Assessment Composition (
- Page 59 and 60:
Municipal Study 2011Unweighted Asse
- Page 61 and 62:
Municipal Study 2011Top 10 Municipa
- Page 63 and 64:
Municipal Study 20112011 Shift In T
- Page 65 and 66:
Municipal Study 2011Building Permit
- Page 67 and 68:
Municipal Study 2011Municipal Finan
- Page 69 and 70:
Municipal Study 2011Evaluating a Mu
- Page 71 and 72:
Financial Position Per Capita—Tre
- Page 73 and 74:
Municipal Study 2011Operating Surpl
- Page 75 and 76:
Municipal Study 20112010 Operating
- Page 77 and 78:
Municipal Study 2011ReservesReserve
- Page 79 and 80:
Municipal Study 2011Discretionary R
- Page 81 and 82:
Municipal Study 2011Tax Debt Intere
- Page 83 and 84:
Municipal Study 2011Debt To Reserve
- Page 85 and 86:
Municipal Study 2011Debt Outstandin
- Page 87 and 88:
Municipal Study 2011Net Financial L
- Page 89 and 90:
Municipal Study 2011Revenue and Exp
- Page 91 and 92:
Municipal Study 2011Environmental S
- Page 93 and 94:
Municipal Study 2011Net Municipal L
- Page 95 and 96:
Municipal Study 20112011 Net Munici
- Page 97 and 98:
Municipal Study 2011Net Municipal L
- Page 99 and 100:
Municipal Study 2011Net Municipal L
- Page 101 and 102:
Municipal Study 20112011 Net Munici
- Page 103 and 104:
Municipal Study 20112011 Net Munici
- Page 105 and 106:
General Government(Sorted by Net Co
- Page 107 and 108:
Municipal Study 2011FireThe goal of
- Page 109 and 110:
Municipal Study 2011Fire Statistics
- Page 111 and 112:
Municipal Study 2011Fire Costs (con
- Page 113 and 114:
Municipal Study 2011Police(Sorted b
- Page 115 and 116:
Municipal Study 2011Court Security
- Page 117 and 118:
Municipal Study 2011Protective Insp
- Page 119 and 120:
Municipal Study 2011Roads ServicesA
- Page 121 and 122:
Municipal Study 2011Roadways—Pave
- Page 123 and 124:
Municipal Study 2011Roadways—Pave
- Page 125 and 126:
Roadways—Bridges and Culverts(Sor
- Page 127 and 128:
Roadways—Traffic Operations(Sorte
- Page 129 and 130:
Winter Control—Except Sidewalks,
- Page 131 and 132:
Winter Control—Sidewalks, Parking
- Page 133 and 134:
Municipal Study 2011Transit Service
- Page 135 and 136: Municipal Study 2011ParkingParking
- Page 137 and 138: Street Lighting(Sorted by Net Costs
- Page 139 and 140: Storm Sewer - Urban(Sorted by Net C
- Page 141 and 142: Storm Sewer - Rural(Sorted by Net C
- Page 143 and 144: Waste Collection(Sorted by Net Cost
- Page 145 and 146: Waste Diversion(Sorted by Net Costs
- Page 147 and 148: Public Health Services(Sorted by Ne
- Page 149 and 150: Municipal Study 2011Ambulance Servi
- Page 151 and 152: Municipal Study 2011Emergency Measu
- Page 153 and 154: Municipal Study 2011General Assista
- Page 155 and 156: Assistance to the Aged(Sorted by Ne
- Page 157 and 158: Municipal Study 2011Social HousingS
- Page 159 and 160: Municipal Study 2011Social Housing(
- Page 161 and 162: Social Housing(Sorted by Total Net
- Page 163 and 164: Parks(Sorted by Net Costs per $100,
- Page 165 and 166: Municipal Study 2011Sports and Recr
- Page 167 and 168: Recreation Programming Cont’d(Sor
- Page 169 and 170: Recreation Facilities—Other(sorte
- Page 171 and 172: Recreation Facilities and Programmi
- Page 173 and 174: Municipal Study 2011LibraryPARTNERI
- Page 175 and 176: Municipal Study 2011Library (cont
- Page 177 and 178: Municipal Study 2011Cultural Servic
- Page 179 and 180: Municipal Study 2011PlanningMunicip
- Page 181 and 182: Commercial and Industrial(Sorted by
- Page 183 and 184: Municipal Study 2011User FeesAnalyz
- Page 185: Municipal Study 2011SingleDetachedD
- Page 189 and 190: SingleDetachedDwellingsper unitToro
- Page 191 and 192: 2011 Building Permit Fees (sorted a
- Page 193 and 194: 2011 Building Permit Fees (sorted b
- Page 195 and 196: Municipal Study 20112011 Transit Fa
- Page 197 and 198: Municipal Study 2011Tax PoliciesThe
- Page 199 and 200: Municipal Study 2011Multi-Residenti
- Page 201 and 202: Municipal Study 2011Industrial (res
- Page 203 and 204: Municipal Study 2011New Multi-Resid
- Page 205 and 206: Municipal Study 2011Comparison of R
- Page 207 and 208: Municipal Study 2011General Introdu
- Page 209 and 210: Municipal Study 20112011 Total Prop
- Page 211 and 212: Municipal Study 20112011 Education
- Page 213 and 214: 2011 Municipal Rates (Upper and Low
- Page 215 and 216: Municipal Study 2011Presentation of
- Page 217 and 218: Municipal Study 2011Residential Com
- Page 219 and 220: Municipal Study 2011Residential Com
- Page 221 and 222: Municipal Study 2011Residential Com
- Page 223 and 224: Municipal Study 2011Residential Com
- Page 225 and 226: Municipal Study 2011Residential Com
- Page 227 and 228: Municipal Study 2011Residential Com
- Page 229 and 230: Municipal Study 2011Residential Com
- Page 231 and 232: Multi-Residential Walk-Ups(taxes ca
- Page 233 and 234: Municipal Study 2011Multi-Residenti
- Page 235 and 236: Multi-Residential Comparisons - Wal
- Page 237 and 238:
Municipal Study 2011Multi-Residenti
- Page 239 and 240:
Municipal Study 2011Multi-Residenti
- Page 241 and 242:
Municipal Study 2011Multi-Residenti
- Page 243 and 244:
Municipal Study 2011Multi-Residenti
- Page 245 and 246:
Commercial Comparisons - Office Bui
- Page 247 and 248:
Municipal Study 2011Commercial Comp
- Page 249 and 250:
Municipal Study 2011Commercial Comp
- Page 251 and 252:
Municipal Study 2011Commercial Comp
- Page 253 and 254:
Commercial Comparisons - Neighbourh
- Page 255 and 256:
Municipal Study 2011Commercial Comp
- Page 257 and 258:
Municipal Study 2011Commercial Comp
- Page 259 and 260:
Municipal Study 2011Commercial Comp
- Page 261 and 262:
Municipal Study 2011Commercial Comp
- Page 263 and 264:
Municipal Study 2011Commercial Comp
- Page 265 and 266:
Commercial Comparisons - Hotel—by
- Page 267 and 268:
Commercial Comparisons - Hotel—by
- Page 269 and 270:
Municipal Study 2011Commercial Comp
- Page 271 and 272:
Commercial Comparisons - Motel—by
- Page 273 and 274:
Municipal Study 2011Commercial Comp
- Page 275 and 276:
Commercial Comparisons - Motel—by
- Page 277 and 278:
Municipal Study 2011Commercial Summ
- Page 279 and 280:
Commercial Comparisons - Summary (c
- Page 281 and 282:
Municipal Study 2011Industrial Comp
- Page 283 and 284:
Municipal Study 2011Standard Indust
- Page 285 and 286:
Municipal Study 2011$3.00Standard I
- Page 287 and 288:
Municipal Study 2011Standard Indust
- Page 289 and 290:
Municipal Study 2011Large Industria
- Page 291 and 292:
Municipal Study 2011Large Industria
- Page 293 and 294:
Municipal Study 2011Large Industria
- Page 295 and 296:
Municipal Study 2011Large Industria
- Page 297 and 298:
Industrial Comparisons - Industrial
- Page 299 and 300:
Municipal Study 2011Industrial Comp
- Page 301 and 302:
Municipal Study 2011Industrial Comp
- Page 303 and 304:
Municipal Study 2011Industrial Comp
- Page 305 and 306:
Municipal Study 2011Industrial Summ
- Page 307 and 308:
Municipal Study 2011Industrial Summ
- Page 309 and 310:
Municipal Study 2011Water/Wastewate
- Page 311 and 312:
Municipal Study 2011Water and Waste
- Page 313 and 314:
Municipal Study 2011Comparison of R
- Page 315 and 316:
Municipal Study 2011Comparison of T
- Page 317 and 318:
Municipal Study 2011Comparison of W
- Page 319 and 320:
Municipal Study 2011Comparison of W
- Page 321 and 322:
Municipal Study 2011Comparison of W
- Page 323 and 324:
Water/Wastewater Costs as a Percent
- Page 325 and 326:
Municipal Study 2011Water and Waste
- Page 327 and 328:
Municipal Study 2011Water and Waste
- Page 329 and 330:
Municipal Study 2011Wastewater Oper
- Page 331 and 332:
Municipal Study 2011Wastewater Asse
- Page 333 and 334:
Municipal Study 2011Water Reserves
- Page 335 and 336:
Municipal Study 2011Wastewater Rese
- Page 337 and 338:
Municipal Study 2011Wastewater Debt
- Page 339 and 340:
Municipal Study 2011Water Net Finan
- Page 341 and 342:
Municipal Study 2011Wastewater Net
- Page 343 and 344:
Municipal Study 2011Water MPMPs Con
- Page 345 and 346:
Municipal Study 2011Wastewater MPMP
- Page 347 and 348:
Municipal Study 2011Taxes and Water
- Page 349 and 350:
Average Household Income and Dwelli
- Page 351 and 352:
Property Taxes as a Percentage of I
- Page 353 and 354:
Municipal Study 2011Total Municipal
- Page 355 and 356:
Municipal Study 2011Total Municipal
- Page 357 and 358:
Municipal Study 2011Economic Develo
- Page 359 and 360:
Municipal Study 2011Section 4 of th
- Page 361 and 362:
Municipal Study 2011Business Retent
- Page 363 and 364:
Municipal Study 2011Business Retent
- Page 365 and 366:
Municipal Study 2011Business Retent
- Page 367 and 368:
Municipal Study 2011Business Retent
- Page 369 and 370:
Municipal Study 2011Business Retent
- Page 371 and 372:
Municipal Study 2011Business Retent
- Page 373 and 374:
Municipal Study 2011Business Retent
- Page 375 and 376:
Municipal Study 2011Business Retent
- Page 377 and 378:
Municipal Study 2011Business Retent
- Page 379 and 380:
Municipal Study 2011Business Retent
- Page 381 and 382:
Municipal Study 2011Business Retent
- Page 383 and 384:
Municipal Study 2011Business Retent
- Page 385 and 386:
Municipal Study 2011Downtown/Area S
- Page 387 and 388:
Municipal Study 2011Downtown/Area S
- Page 389 and 390:
Municipal Study 2011Downtown/Area S
- Page 391 and 392:
Municipal Study 2011MunicipalityCor
- Page 393 and 394:
Municipal Study 2011MunicipalityKit
- Page 395 and 396:
Municipal Study 2011Downtown/Area S
- Page 397 and 398:
Municipal Study 2011Downtown/Area S
- Page 399 and 400:
Municipal Study 2011Downtown/Area S
- Page 401 and 402:
Municipal Study 2011WellandWhitbyWh
- Page 403 and 404:
Municipal Study 2011Brownfield Rede
- Page 405 and 406:
Municipal Study 2011Brownfield Rede
- Page 407 and 408:
Municipal Study 2011Brownfield Rede
- Page 409 and 410:
Industrial ParksMunicipal Study 201
- Page 411:
Industrial ParksMunicipal Study 201