- Page 5 and 6:
Municipal Study 2011Executive Summa
- Page 7 and 8:
Municipal Study 2011BrantfordSurvey
- Page 9 and 10: Municipal Study 20112011 Comparison
- Page 11 and 12: Municipal Study 2011SECTION 1: Intr
- Page 13 and 14: Municipal Study 2011Age and Conditi
- Page 15 and 16: Municipal Study 2011Asset Consumpti
- Page 17 and 18: Municipal Study 2011Net municipal l
- Page 19 and 20: Municipal Study 2011SECTION 7: Comp
- Page 21 and 22: Municipal Study 2011SECTION 8: Comp
- Page 23 and 24: Municipal Study 2011Introduction1
- Page 25 and 26: Municipal Study 2011Municipal Study
- Page 27 and 28: Municipal Study 2011Municipalities
- Page 29 and 30: Municipal Study 2011Socio Economic
- Page 31 and 32: Municipal Study 2011Population Stat
- Page 33 and 34: Municipal Study 2011Simcoe/Muskoka/
- Page 35 and 36: Municipal Study 2011Niagara/Hamilto
- Page 37 and 38: Municipal Study 2011Northern——%
- Page 39 and 40: Municipal Study 2011Ontario Populat
- Page 41 and 42: Municipal Study 2011Age Demographic
- Page 43 and 44: Municipal Study 2011% of Dwellings
- Page 45 and 46: Municipal Study 2011Average Househo
- Page 47 and 48: Municipal Study 2011Land Area and D
- Page 49 and 50: Municipal Study 2011Land Area and D
- Page 51 and 52: Municipal Study 2011Assessment Per
- Page 53 and 54: Municipal Study 2011Taxable Assessm
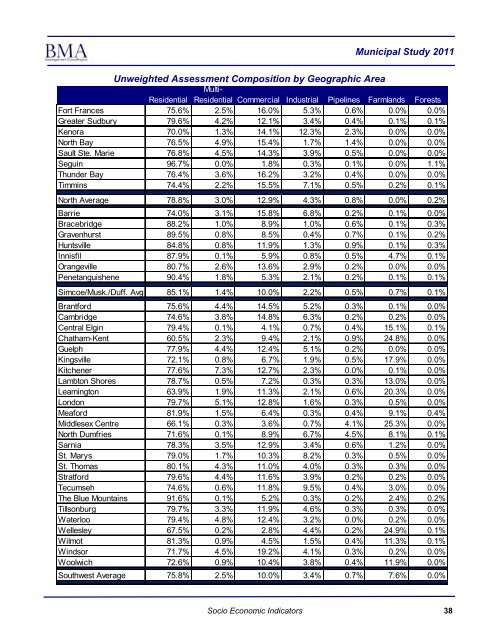
- Page 55 and 56: Municipal Study 2011Unweighted Asse
- Page 57 and 58: Unweighted Assessment Composition (
- Page 59: Municipal Study 2011Unweighted Asse
- Page 63 and 64: Municipal Study 20112011 Shift In T
- Page 65 and 66: Municipal Study 2011Building Permit
- Page 67 and 68: Municipal Study 2011Municipal Finan
- Page 69 and 70: Municipal Study 2011Evaluating a Mu
- Page 71 and 72: Financial Position Per Capita—Tre
- Page 73 and 74: Municipal Study 2011Operating Surpl
- Page 75 and 76: Municipal Study 20112010 Operating
- Page 77 and 78: Municipal Study 2011ReservesReserve
- Page 79 and 80: Municipal Study 2011Discretionary R
- Page 81 and 82: Municipal Study 2011Tax Debt Intere
- Page 83 and 84: Municipal Study 2011Debt To Reserve
- Page 85 and 86: Municipal Study 2011Debt Outstandin
- Page 87 and 88: Municipal Study 2011Net Financial L
- Page 89 and 90: Municipal Study 2011Revenue and Exp
- Page 91 and 92: Municipal Study 2011Environmental S
- Page 93 and 94: Municipal Study 2011Net Municipal L
- Page 95 and 96: Municipal Study 20112011 Net Munici
- Page 97 and 98: Municipal Study 2011Net Municipal L
- Page 99 and 100: Municipal Study 2011Net Municipal L
- Page 101 and 102: Municipal Study 20112011 Net Munici
- Page 103 and 104: Municipal Study 20112011 Net Munici
- Page 105 and 106: General Government(Sorted by Net Co
- Page 107 and 108: Municipal Study 2011FireThe goal of
- Page 109 and 110: Municipal Study 2011Fire Statistics
- Page 111 and 112:
Municipal Study 2011Fire Costs (con
- Page 113 and 114:
Municipal Study 2011Police(Sorted b
- Page 115 and 116:
Municipal Study 2011Court Security
- Page 117 and 118:
Municipal Study 2011Protective Insp
- Page 119 and 120:
Municipal Study 2011Roads ServicesA
- Page 121 and 122:
Municipal Study 2011Roadways—Pave
- Page 123 and 124:
Municipal Study 2011Roadways—Pave
- Page 125 and 126:
Roadways—Bridges and Culverts(Sor
- Page 127 and 128:
Roadways—Traffic Operations(Sorte
- Page 129 and 130:
Winter Control—Except Sidewalks,
- Page 131 and 132:
Winter Control—Sidewalks, Parking
- Page 133 and 134:
Municipal Study 2011Transit Service
- Page 135 and 136:
Municipal Study 2011ParkingParking
- Page 137 and 138:
Street Lighting(Sorted by Net Costs
- Page 139 and 140:
Storm Sewer - Urban(Sorted by Net C
- Page 141 and 142:
Storm Sewer - Rural(Sorted by Net C
- Page 143 and 144:
Waste Collection(Sorted by Net Cost
- Page 145 and 146:
Waste Diversion(Sorted by Net Costs
- Page 147 and 148:
Public Health Services(Sorted by Ne
- Page 149 and 150:
Municipal Study 2011Ambulance Servi
- Page 151 and 152:
Municipal Study 2011Emergency Measu
- Page 153 and 154:
Municipal Study 2011General Assista
- Page 155 and 156:
Assistance to the Aged(Sorted by Ne
- Page 157 and 158:
Municipal Study 2011Social HousingS
- Page 159 and 160:
Municipal Study 2011Social Housing(
- Page 161 and 162:
Social Housing(Sorted by Total Net
- Page 163 and 164:
Parks(Sorted by Net Costs per $100,
- Page 165 and 166:
Municipal Study 2011Sports and Recr
- Page 167 and 168:
Recreation Programming Cont’d(Sor
- Page 169 and 170:
Recreation Facilities—Other(sorte
- Page 171 and 172:
Recreation Facilities and Programmi
- Page 173 and 174:
Municipal Study 2011LibraryPARTNERI
- Page 175 and 176:
Municipal Study 2011Library (cont
- Page 177 and 178:
Municipal Study 2011Cultural Servic
- Page 179 and 180:
Municipal Study 2011PlanningMunicip
- Page 181 and 182:
Commercial and Industrial(Sorted by
- Page 183 and 184:
Municipal Study 2011User FeesAnalyz
- Page 185 and 186:
Municipal Study 2011SingleDetachedD
- Page 187 and 188:
2011 Development Charges—Grouped
- Page 189 and 190:
SingleDetachedDwellingsper unitToro
- Page 191 and 192:
2011 Building Permit Fees (sorted a
- Page 193 and 194:
2011 Building Permit Fees (sorted b
- Page 195 and 196:
Municipal Study 20112011 Transit Fa
- Page 197 and 198:
Municipal Study 2011Tax PoliciesThe
- Page 199 and 200:
Municipal Study 2011Multi-Residenti
- Page 201 and 202:
Municipal Study 2011Industrial (res
- Page 203 and 204:
Municipal Study 2011New Multi-Resid
- Page 205 and 206:
Municipal Study 2011Comparison of R
- Page 207 and 208:
Municipal Study 2011General Introdu
- Page 209 and 210:
Municipal Study 20112011 Total Prop
- Page 211 and 212:
Municipal Study 20112011 Education
- Page 213 and 214:
2011 Municipal Rates (Upper and Low
- Page 215 and 216:
Municipal Study 2011Presentation of
- Page 217 and 218:
Municipal Study 2011Residential Com
- Page 219 and 220:
Municipal Study 2011Residential Com
- Page 221 and 222:
Municipal Study 2011Residential Com
- Page 223 and 224:
Municipal Study 2011Residential Com
- Page 225 and 226:
Municipal Study 2011Residential Com
- Page 227 and 228:
Municipal Study 2011Residential Com
- Page 229 and 230:
Municipal Study 2011Residential Com
- Page 231 and 232:
Multi-Residential Walk-Ups(taxes ca
- Page 233 and 234:
Municipal Study 2011Multi-Residenti
- Page 235 and 236:
Multi-Residential Comparisons - Wal
- Page 237 and 238:
Municipal Study 2011Multi-Residenti
- Page 239 and 240:
Municipal Study 2011Multi-Residenti
- Page 241 and 242:
Municipal Study 2011Multi-Residenti
- Page 243 and 244:
Municipal Study 2011Multi-Residenti
- Page 245 and 246:
Commercial Comparisons - Office Bui
- Page 247 and 248:
Municipal Study 2011Commercial Comp
- Page 249 and 250:
Municipal Study 2011Commercial Comp
- Page 251 and 252:
Municipal Study 2011Commercial Comp
- Page 253 and 254:
Commercial Comparisons - Neighbourh
- Page 255 and 256:
Municipal Study 2011Commercial Comp
- Page 257 and 258:
Municipal Study 2011Commercial Comp
- Page 259 and 260:
Municipal Study 2011Commercial Comp
- Page 261 and 262:
Municipal Study 2011Commercial Comp
- Page 263 and 264:
Municipal Study 2011Commercial Comp
- Page 265 and 266:
Commercial Comparisons - Hotel—by
- Page 267 and 268:
Commercial Comparisons - Hotel—by
- Page 269 and 270:
Municipal Study 2011Commercial Comp
- Page 271 and 272:
Commercial Comparisons - Motel—by
- Page 273 and 274:
Municipal Study 2011Commercial Comp
- Page 275 and 276:
Commercial Comparisons - Motel—by
- Page 277 and 278:
Municipal Study 2011Commercial Summ
- Page 279 and 280:
Commercial Comparisons - Summary (c
- Page 281 and 282:
Municipal Study 2011Industrial Comp
- Page 283 and 284:
Municipal Study 2011Standard Indust
- Page 285 and 286:
Municipal Study 2011$3.00Standard I
- Page 287 and 288:
Municipal Study 2011Standard Indust
- Page 289 and 290:
Municipal Study 2011Large Industria
- Page 291 and 292:
Municipal Study 2011Large Industria
- Page 293 and 294:
Municipal Study 2011Large Industria
- Page 295 and 296:
Municipal Study 2011Large Industria
- Page 297 and 298:
Industrial Comparisons - Industrial
- Page 299 and 300:
Municipal Study 2011Industrial Comp
- Page 301 and 302:
Municipal Study 2011Industrial Comp
- Page 303 and 304:
Municipal Study 2011Industrial Comp
- Page 305 and 306:
Municipal Study 2011Industrial Summ
- Page 307 and 308:
Municipal Study 2011Industrial Summ
- Page 309 and 310:
Municipal Study 2011Water/Wastewate
- Page 311 and 312:
Municipal Study 2011Water and Waste
- Page 313 and 314:
Municipal Study 2011Comparison of R
- Page 315 and 316:
Municipal Study 2011Comparison of T
- Page 317 and 318:
Municipal Study 2011Comparison of W
- Page 319 and 320:
Municipal Study 2011Comparison of W
- Page 321 and 322:
Municipal Study 2011Comparison of W
- Page 323 and 324:
Water/Wastewater Costs as a Percent
- Page 325 and 326:
Municipal Study 2011Water and Waste
- Page 327 and 328:
Municipal Study 2011Water and Waste
- Page 329 and 330:
Municipal Study 2011Wastewater Oper
- Page 331 and 332:
Municipal Study 2011Wastewater Asse
- Page 333 and 334:
Municipal Study 2011Water Reserves
- Page 335 and 336:
Municipal Study 2011Wastewater Rese
- Page 337 and 338:
Municipal Study 2011Wastewater Debt
- Page 339 and 340:
Municipal Study 2011Water Net Finan
- Page 341 and 342:
Municipal Study 2011Wastewater Net
- Page 343 and 344:
Municipal Study 2011Water MPMPs Con
- Page 345 and 346:
Municipal Study 2011Wastewater MPMP
- Page 347 and 348:
Municipal Study 2011Taxes and Water
- Page 349 and 350:
Average Household Income and Dwelli
- Page 351 and 352:
Property Taxes as a Percentage of I
- Page 353 and 354:
Municipal Study 2011Total Municipal
- Page 355 and 356:
Municipal Study 2011Total Municipal
- Page 357 and 358:
Municipal Study 2011Economic Develo
- Page 359 and 360:
Municipal Study 2011Section 4 of th
- Page 361 and 362:
Municipal Study 2011Business Retent
- Page 363 and 364:
Municipal Study 2011Business Retent
- Page 365 and 366:
Municipal Study 2011Business Retent
- Page 367 and 368:
Municipal Study 2011Business Retent
- Page 369 and 370:
Municipal Study 2011Business Retent
- Page 371 and 372:
Municipal Study 2011Business Retent
- Page 373 and 374:
Municipal Study 2011Business Retent
- Page 375 and 376:
Municipal Study 2011Business Retent
- Page 377 and 378:
Municipal Study 2011Business Retent
- Page 379 and 380:
Municipal Study 2011Business Retent
- Page 381 and 382:
Municipal Study 2011Business Retent
- Page 383 and 384:
Municipal Study 2011Business Retent
- Page 385 and 386:
Municipal Study 2011Downtown/Area S
- Page 387 and 388:
Municipal Study 2011Downtown/Area S
- Page 389 and 390:
Municipal Study 2011Downtown/Area S
- Page 391 and 392:
Municipal Study 2011MunicipalityCor
- Page 393 and 394:
Municipal Study 2011MunicipalityKit
- Page 395 and 396:
Municipal Study 2011Downtown/Area S
- Page 397 and 398:
Municipal Study 2011Downtown/Area S
- Page 399 and 400:
Municipal Study 2011Downtown/Area S
- Page 401 and 402:
Municipal Study 2011WellandWhitbyWh
- Page 403 and 404:
Municipal Study 2011Brownfield Rede
- Page 405 and 406:
Municipal Study 2011Brownfield Rede
- Page 407 and 408:
Municipal Study 2011Brownfield Rede
- Page 409 and 410:
Industrial ParksMunicipal Study 201
- Page 411:
Industrial ParksMunicipal Study 201