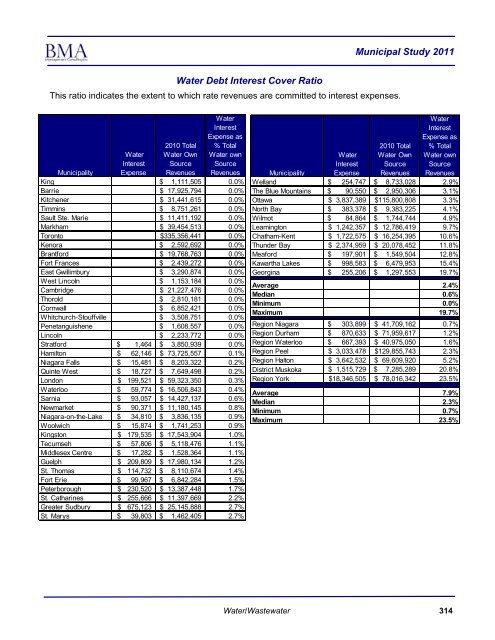
<strong>Municipal</strong> <strong>Study</strong> <strong>2011</strong>Water Debt Interest Cover RatioThis ratio indicates the extent to which rate revenues are committed to interest expenses.2010 TotalWater OwnSourceWaterInterestExpense as% TotalWater ownSource<strong>Municipal</strong>ityWaterInterestExpense Revenues RevenuesKing $ 1,111,505 0.0%Barrie $ 17,925,794 0.0%Kitchener $ 31,441,615 0.0%Timmins $ 8,751,261 0.0%Sault Ste. Marie $ 11,411,192 0.0%Markham $ 39,454,513 0.0%Toronto $ 335,356,441 0.0%Kenora $ 2,592,692 0.0%<strong>Brantford</strong> $ 19,768,763 0.0%Fort Frances $ 2,439,272 0.0%East Gwillimbury $ 3,290,874 0.0%West Lincoln $ 1,153,184 0.0%Cambridge $ 21,227,476 0.0%Thorold $ 2,810,181 0.0%Cornwall $ 6,852,421 0.0%Whitchurch-Stouffville $ 3,508,751 0.0%Penetanguishene $ 1,608,557 0.0%Lincoln $ 2,233,772 0.0%Stratford $ 1,464 $ 3,850,939 0.0%Hamilton $ 62,146 $ 73,725,557 0.1%Niagara Falls $ 15,481 $ 8,203,322 0.2%Quinte West $ 18,727 $ 7,649,498 0.2%London $ 199,521 $ 59,323,350 0.3%Waterloo $ 59,774 $ 16,506,843 0.4%Sarnia $ 93,057 $ 14,427,137 0.6%Newmarket $ 90,371 $ 11,180,145 0.8%Niagara-on-the-Lake $ 34,810 $ 3,836,135 0.9%Woolwich $ 15,874 $ 1,741,253 0.9%Kingston $ 179,535 $ 17,543,904 1.0%Tecumseh $ 57,806 $ 5,118,476 1.1%Middlesex Centre $ 17,282 $ 1,528,364 1.1%Guelph $ 209,809 $ 17,980,134 1.2%St. Thomas $ 114,732 $ 8,110,674 1.4%Fort Erie $ 99,967 $ 6,842,284 1.5%Peterborough $ 230,520 $ 13,387,448 1.7%St. Catharines $ 255,666 $ 11,397,669 2.2%Greater Sudbury $ 675,123 $ 25,145,888 2.7%St. Marys $ 39,803 $ 1,462,405 2.7%WaterInterestExpense as<strong>Municipal</strong>ityWaterInterestExpense2010 TotalWater OwnSourceRevenues% TotalWater ownSourceRevenuesWelland $ 254,747 $ 8,733,028 2.9%The Blue Mountains $ 90,550 $ 2,950,306 3.1%Ottawa $ 3,837,389 $ 115,800,808 3.3%North Bay $ 383,378 $ 9,383,225 4.1%Wilmot $ 84,864 $ 1,744,744 4.9%Leamington $ 1,242,357 $ 12,786,419 9.7%Chatham-Kent $ 1,722,575 $ 16,254,395 10.6%Thunder Bay $ 2,374,959 $ 20,078,452 11.8%Meaford $ 197,901 $ 1,549,504 12.8%Kawartha Lakes $ 998,583 $ 6,479,953 15.4%Georgina $ 255,206 $ 1,297,553 19.7%Average 2.4%Median 0.6%Minimum 0.0%Maximum 19.7%Region Niagara $ 303,899 $ 41,709,162 0.7%Region Durham $ 870,633 $ 71,959,617 1.2%Region Waterloo $ 667,393 $ 40,975,050 1.6%Region Peel $ 3,033,478 $ 129,855,743 2.3%Region Halton $ 3,642,532 $ 69,609,920 5.2%District Muskoka $ 1,515,729 $ 7,285,289 20.8%Region York $ 18,346,505 $ 78,016,342 23.5%Average 7.9%Median 2.3%Minimum 0.7%Maximum 23.5%Water/Wastewater314
<strong>Municipal</strong> <strong>Study</strong> <strong>2011</strong>Wastewater Debt Interest Cover Ratio2010 TotalWastewater OwnSourceWastewaterInterestExpense as %Total Water ownSource<strong>Municipal</strong>ityWastewaterInterestExpense Revenues Revenues<strong>Brantford</strong> $ 15,257,6220.0%Cambridge $ 20,221,4700.0%Cornwall $ 7,221,6510.0%Greater Sudbury $ 26,019,2300.0%Kenora $ 2,462,5060.0%Kitchener $ 35,666,4810.0%Lincoln $ 549,9200.0%Markham $ 29,139,6240.0%North Bay $ 8,708,5270.0%Penetanguishene $ 1,726,0460.0%Quinte West $ 3,314,2860.0%Sault Ste. Marie $ 11,239,8770.0%St. Thomas $ 5,974,6490.0%Thorold $ 2,695,9300.0%Timmins $ 5,324,5250.0%Toronto $ 417,287,3120.0%West Lincoln $ 408,3410.0%Whitchurch-Stouffville $ 2,465,9940.0%Wilmot $ 1,479,9840.0%Waterloo $ 22,050 $ 15,765,0170.1%Hamilton $ 173,481 $ 74,480,1170.2%Woolwich $ 7,467 $ 1,140,2740.7%Welland $ 82,314 $ 11,557,0230.7%Newmarket $ 92,371 $ 9,850,1140.9%Stratford $ 50,604 $ 5,236,2651.0%Niagara-on-the-Lake $ 28,201 $ 2,706,5191.0%Guelph $ 246,450 $ 21,216,1261.2%Fort Erie $ 110,889 $ 7,840,2701.4%Peterborough $ 229,393 $ 14,763,9941.6%Windsor $ 963,989 $ 56,390,3021.7%London $ 1,518,426 $ 66,316,3852.3%St. Marys $ 17,767 $ 746,5882.4%Fort Frances $ 54,909 $ 2,098,5462.6%Niagara Falls $ 212,364 $ 7,777,6912.7%The Blue Mountains $ 124,352 $ 2,292,0875.4%Kawartha Lakes $ 333,147 $ 6,102,8835.5%St. Catharines $ 285,446 $ 4,925,8075.8%WastewaterInterest2010 Total Expense as %Wastewater Wastewater Own Total Water own<strong>Municipal</strong>ityInterestExpenseSourceRevenuesSourceRevenuesMiddlesex Centre $ 75,064 $ 1,253,2306.0%Ottawa $ 6,965,601 $ 115,800,8086.0%Sarnia $ 920,371 $ 14,847,1096.2%Meaford $ 70,940 $ 1,038,8616.8%Thunder Bay $ 1,003,950 $ 13,450,6627.5%Chatham-Kent $ 1,214,854 $ 12,038,13210.1%Kingston $ 2,437,735 $ 23,317,85110.5%Tecumseh $ 359,464 $ 3,068,82911.7%Barrie $ 2,427,366 $ 16,408,52914.8%Leamington $ 880,798 $ 5,409,72716.3%Georgina $ 446,248 $ 1,329,88733.6%King $ 569,807 $ 662,46286.0%Average 5.2%Median 1.0%Minimum 0.0%Maximum 86.0%Region Waterloo $ 12,519 $ 40,512,2260.0%Region Durham $ 2,809,449 $ 99,389,2472.8%Region Niagara $ 2,022,845 $ 60,339,4403.4%Region Peel $ 3,540,614 $ 99,471,7893.6%Region Halton $ 2,614,854 $ 72,453,6563.6%Region York $ 33,991,578 $ 86,824,03939.1%District Muskoka $ 2,359,024 $ 5,795,31340.7%Average 13.3%Median 3.6%Minimum 0.0%Maximum 40.7%Water/Wastewater315
- Page 5 and 6:
Municipal Study 2011Executive Summa
- Page 7 and 8:
Municipal Study 2011BrantfordSurvey
- Page 9 and 10:
Municipal Study 20112011 Comparison
- Page 11 and 12:
Municipal Study 2011SECTION 1: Intr
- Page 13 and 14:
Municipal Study 2011Age and Conditi
- Page 15 and 16:
Municipal Study 2011Asset Consumpti
- Page 17 and 18:
Municipal Study 2011Net municipal l
- Page 19 and 20:
Municipal Study 2011SECTION 7: Comp
- Page 21 and 22:
Municipal Study 2011SECTION 8: Comp
- Page 23 and 24:
Municipal Study 2011Introduction1
- Page 25 and 26:
Municipal Study 2011Municipal Study
- Page 27 and 28:
Municipal Study 2011Municipalities
- Page 29 and 30:
Municipal Study 2011Socio Economic
- Page 31 and 32:
Municipal Study 2011Population Stat
- Page 33 and 34:
Municipal Study 2011Simcoe/Muskoka/
- Page 35 and 36:
Municipal Study 2011Niagara/Hamilto
- Page 37 and 38:
Municipal Study 2011Northern——%
- Page 39 and 40:
Municipal Study 2011Ontario Populat
- Page 41 and 42:
Municipal Study 2011Age Demographic
- Page 43 and 44:
Municipal Study 2011% of Dwellings
- Page 45 and 46:
Municipal Study 2011Average Househo
- Page 47 and 48:
Municipal Study 2011Land Area and D
- Page 49 and 50:
Municipal Study 2011Land Area and D
- Page 51 and 52:
Municipal Study 2011Assessment Per
- Page 53 and 54:
Municipal Study 2011Taxable Assessm
- Page 55 and 56:
Municipal Study 2011Unweighted Asse
- Page 57 and 58:
Unweighted Assessment Composition (
- Page 59 and 60:
Municipal Study 2011Unweighted Asse
- Page 61 and 62:
Municipal Study 2011Top 10 Municipa
- Page 63 and 64:
Municipal Study 20112011 Shift In T
- Page 65 and 66:
Municipal Study 2011Building Permit
- Page 67 and 68:
Municipal Study 2011Municipal Finan
- Page 69 and 70:
Municipal Study 2011Evaluating a Mu
- Page 71 and 72:
Financial Position Per Capita—Tre
- Page 73 and 74:
Municipal Study 2011Operating Surpl
- Page 75 and 76:
Municipal Study 20112010 Operating
- Page 77 and 78:
Municipal Study 2011ReservesReserve
- Page 79 and 80:
Municipal Study 2011Discretionary R
- Page 81 and 82:
Municipal Study 2011Tax Debt Intere
- Page 83 and 84:
Municipal Study 2011Debt To Reserve
- Page 85 and 86:
Municipal Study 2011Debt Outstandin
- Page 87 and 88:
Municipal Study 2011Net Financial L
- Page 89 and 90:
Municipal Study 2011Revenue and Exp
- Page 91 and 92:
Municipal Study 2011Environmental S
- Page 93 and 94:
Municipal Study 2011Net Municipal L
- Page 95 and 96:
Municipal Study 20112011 Net Munici
- Page 97 and 98:
Municipal Study 2011Net Municipal L
- Page 99 and 100:
Municipal Study 2011Net Municipal L
- Page 101 and 102:
Municipal Study 20112011 Net Munici
- Page 103 and 104:
Municipal Study 20112011 Net Munici
- Page 105 and 106:
General Government(Sorted by Net Co
- Page 107 and 108:
Municipal Study 2011FireThe goal of
- Page 109 and 110:
Municipal Study 2011Fire Statistics
- Page 111 and 112:
Municipal Study 2011Fire Costs (con
- Page 113 and 114:
Municipal Study 2011Police(Sorted b
- Page 115 and 116:
Municipal Study 2011Court Security
- Page 117 and 118:
Municipal Study 2011Protective Insp
- Page 119 and 120:
Municipal Study 2011Roads ServicesA
- Page 121 and 122:
Municipal Study 2011Roadways—Pave
- Page 123 and 124:
Municipal Study 2011Roadways—Pave
- Page 125 and 126:
Roadways—Bridges and Culverts(Sor
- Page 127 and 128:
Roadways—Traffic Operations(Sorte
- Page 129 and 130:
Winter Control—Except Sidewalks,
- Page 131 and 132:
Winter Control—Sidewalks, Parking
- Page 133 and 134:
Municipal Study 2011Transit Service
- Page 135 and 136:
Municipal Study 2011ParkingParking
- Page 137 and 138:
Street Lighting(Sorted by Net Costs
- Page 139 and 140:
Storm Sewer - Urban(Sorted by Net C
- Page 141 and 142:
Storm Sewer - Rural(Sorted by Net C
- Page 143 and 144:
Waste Collection(Sorted by Net Cost
- Page 145 and 146:
Waste Diversion(Sorted by Net Costs
- Page 147 and 148:
Public Health Services(Sorted by Ne
- Page 149 and 150:
Municipal Study 2011Ambulance Servi
- Page 151 and 152:
Municipal Study 2011Emergency Measu
- Page 153 and 154:
Municipal Study 2011General Assista
- Page 155 and 156:
Assistance to the Aged(Sorted by Ne
- Page 157 and 158:
Municipal Study 2011Social HousingS
- Page 159 and 160:
Municipal Study 2011Social Housing(
- Page 161 and 162:
Social Housing(Sorted by Total Net
- Page 163 and 164:
Parks(Sorted by Net Costs per $100,
- Page 165 and 166:
Municipal Study 2011Sports and Recr
- Page 167 and 168:
Recreation Programming Cont’d(Sor
- Page 169 and 170:
Recreation Facilities—Other(sorte
- Page 171 and 172:
Recreation Facilities and Programmi
- Page 173 and 174:
Municipal Study 2011LibraryPARTNERI
- Page 175 and 176:
Municipal Study 2011Library (cont
- Page 177 and 178:
Municipal Study 2011Cultural Servic
- Page 179 and 180:
Municipal Study 2011PlanningMunicip
- Page 181 and 182:
Commercial and Industrial(Sorted by
- Page 183 and 184:
Municipal Study 2011User FeesAnalyz
- Page 185 and 186:
Municipal Study 2011SingleDetachedD
- Page 187 and 188:
2011 Development Charges—Grouped
- Page 189 and 190:
SingleDetachedDwellingsper unitToro
- Page 191 and 192:
2011 Building Permit Fees (sorted a
- Page 193 and 194:
2011 Building Permit Fees (sorted b
- Page 195 and 196:
Municipal Study 20112011 Transit Fa
- Page 197 and 198:
Municipal Study 2011Tax PoliciesThe
- Page 199 and 200:
Municipal Study 2011Multi-Residenti
- Page 201 and 202:
Municipal Study 2011Industrial (res
- Page 203 and 204:
Municipal Study 2011New Multi-Resid
- Page 205 and 206:
Municipal Study 2011Comparison of R
- Page 207 and 208:
Municipal Study 2011General Introdu
- Page 209 and 210:
Municipal Study 20112011 Total Prop
- Page 211 and 212:
Municipal Study 20112011 Education
- Page 213 and 214:
2011 Municipal Rates (Upper and Low
- Page 215 and 216:
Municipal Study 2011Presentation of
- Page 217 and 218:
Municipal Study 2011Residential Com
- Page 219 and 220:
Municipal Study 2011Residential Com
- Page 221 and 222:
Municipal Study 2011Residential Com
- Page 223 and 224:
Municipal Study 2011Residential Com
- Page 225 and 226:
Municipal Study 2011Residential Com
- Page 227 and 228:
Municipal Study 2011Residential Com
- Page 229 and 230:
Municipal Study 2011Residential Com
- Page 231 and 232:
Multi-Residential Walk-Ups(taxes ca
- Page 233 and 234:
Municipal Study 2011Multi-Residenti
- Page 235 and 236:
Multi-Residential Comparisons - Wal
- Page 237 and 238:
Municipal Study 2011Multi-Residenti
- Page 239 and 240:
Municipal Study 2011Multi-Residenti
- Page 241 and 242:
Municipal Study 2011Multi-Residenti
- Page 243 and 244:
Municipal Study 2011Multi-Residenti
- Page 245 and 246:
Commercial Comparisons - Office Bui
- Page 247 and 248:
Municipal Study 2011Commercial Comp
- Page 249 and 250:
Municipal Study 2011Commercial Comp
- Page 251 and 252:
Municipal Study 2011Commercial Comp
- Page 253 and 254:
Commercial Comparisons - Neighbourh
- Page 255 and 256:
Municipal Study 2011Commercial Comp
- Page 257 and 258:
Municipal Study 2011Commercial Comp
- Page 259 and 260:
Municipal Study 2011Commercial Comp
- Page 261 and 262:
Municipal Study 2011Commercial Comp
- Page 263 and 264:
Municipal Study 2011Commercial Comp
- Page 265 and 266:
Commercial Comparisons - Hotel—by
- Page 267 and 268:
Commercial Comparisons - Hotel—by
- Page 269 and 270:
Municipal Study 2011Commercial Comp
- Page 271 and 272:
Commercial Comparisons - Motel—by
- Page 273 and 274:
Municipal Study 2011Commercial Comp
- Page 275 and 276:
Commercial Comparisons - Motel—by
- Page 277 and 278:
Municipal Study 2011Commercial Summ
- Page 279 and 280:
Commercial Comparisons - Summary (c
- Page 281 and 282:
Municipal Study 2011Industrial Comp
- Page 283 and 284:
Municipal Study 2011Standard Indust
- Page 285 and 286: Municipal Study 2011$3.00Standard I
- Page 287 and 288: Municipal Study 2011Standard Indust
- Page 289 and 290: Municipal Study 2011Large Industria
- Page 291 and 292: Municipal Study 2011Large Industria
- Page 293 and 294: Municipal Study 2011Large Industria
- Page 295 and 296: Municipal Study 2011Large Industria
- Page 297 and 298: Industrial Comparisons - Industrial
- Page 299 and 300: Municipal Study 2011Industrial Comp
- Page 301 and 302: Municipal Study 2011Industrial Comp
- Page 303 and 304: Municipal Study 2011Industrial Comp
- Page 305 and 306: Municipal Study 2011Industrial Summ
- Page 307 and 308: Municipal Study 2011Industrial Summ
- Page 309 and 310: Municipal Study 2011Water/Wastewate
- Page 311 and 312: Municipal Study 2011Water and Waste
- Page 313 and 314: Municipal Study 2011Comparison of R
- Page 315 and 316: Municipal Study 2011Comparison of T
- Page 317 and 318: Municipal Study 2011Comparison of W
- Page 319 and 320: Municipal Study 2011Comparison of W
- Page 321 and 322: Municipal Study 2011Comparison of W
- Page 323 and 324: Water/Wastewater Costs as a Percent
- Page 325 and 326: Municipal Study 2011Water and Waste
- Page 327 and 328: Municipal Study 2011Water and Waste
- Page 329 and 330: Municipal Study 2011Wastewater Oper
- Page 331 and 332: Municipal Study 2011Wastewater Asse
- Page 333 and 334: Municipal Study 2011Water Reserves
- Page 335: Municipal Study 2011Wastewater Rese
- Page 339 and 340: Municipal Study 2011Water Net Finan
- Page 341 and 342: Municipal Study 2011Wastewater Net
- Page 343 and 344: Municipal Study 2011Water MPMPs Con
- Page 345 and 346: Municipal Study 2011Wastewater MPMP
- Page 347 and 348: Municipal Study 2011Taxes and Water
- Page 349 and 350: Average Household Income and Dwelli
- Page 351 and 352: Property Taxes as a Percentage of I
- Page 353 and 354: Municipal Study 2011Total Municipal
- Page 355 and 356: Municipal Study 2011Total Municipal
- Page 357 and 358: Municipal Study 2011Economic Develo
- Page 359 and 360: Municipal Study 2011Section 4 of th
- Page 361 and 362: Municipal Study 2011Business Retent
- Page 363 and 364: Municipal Study 2011Business Retent
- Page 365 and 366: Municipal Study 2011Business Retent
- Page 367 and 368: Municipal Study 2011Business Retent
- Page 369 and 370: Municipal Study 2011Business Retent
- Page 371 and 372: Municipal Study 2011Business Retent
- Page 373 and 374: Municipal Study 2011Business Retent
- Page 375 and 376: Municipal Study 2011Business Retent
- Page 377 and 378: Municipal Study 2011Business Retent
- Page 379 and 380: Municipal Study 2011Business Retent
- Page 381 and 382: Municipal Study 2011Business Retent
- Page 383 and 384: Municipal Study 2011Business Retent
- Page 385 and 386: Municipal Study 2011Downtown/Area S
- Page 387 and 388:
Municipal Study 2011Downtown/Area S
- Page 389 and 390:
Municipal Study 2011Downtown/Area S
- Page 391 and 392:
Municipal Study 2011MunicipalityCor
- Page 393 and 394:
Municipal Study 2011MunicipalityKit
- Page 395 and 396:
Municipal Study 2011Downtown/Area S
- Page 397 and 398:
Municipal Study 2011Downtown/Area S
- Page 399 and 400:
Municipal Study 2011Downtown/Area S
- Page 401 and 402:
Municipal Study 2011WellandWhitbyWh
- Page 403 and 404:
Municipal Study 2011Brownfield Rede
- Page 405 and 406:
Municipal Study 2011Brownfield Rede
- Page 407 and 408:
Municipal Study 2011Brownfield Rede
- Page 409 and 410:
Industrial ParksMunicipal Study 201
- Page 411:
Industrial ParksMunicipal Study 201