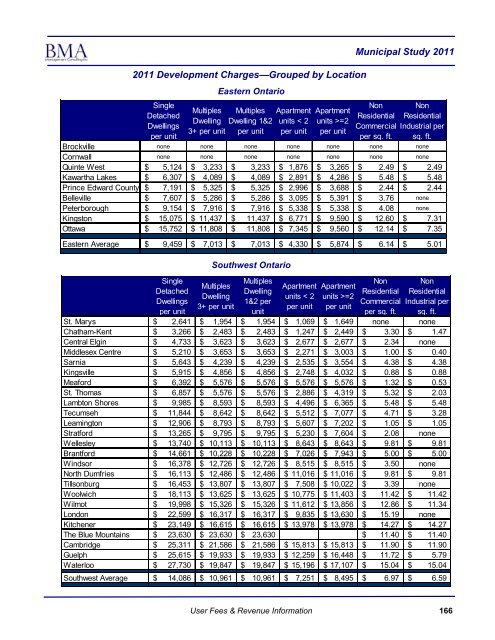
<strong>2011</strong> Development Charges—Grouped by LocationSingleDetachedDwellingsper unitMultiplesDwelling3+ per unitEastern OntarioMultiplesDwelling 1&2per unitSouthwest OntarioApartmentunits < 2per unitApartmentunits >=2per unit<strong>Municipal</strong> <strong>Study</strong> <strong>2011</strong>NonResidentialCommercialper sq. ft.NonResidentialIndustrial persq. ft.Brockville none none none none none none noneCornwall none none none none none none noneQuinte West $ 5,124 $ 3,233 $ 3,233 $ 1,876 $ 3,265 $ 2.49 $ 2.49Kawartha Lakes $ 6,307 $ 4,089 $ 4,089 $ 2,891 $ 4,286 $ 5.48 $ 5.48Prince Edward County $ 7,191 $ 5,325 $ 5,325 $ 2,996 $ 3,688 $ 2.44 $ 2.44Belleville $ 7,607 $ 5,286 $ 5,286 $ 3,095 $ 5,391 $ 3.76 nonePeterborough $ 9,154 $ 7,916 $ 7,916 $ 5,338 $ 5,338 $ 4.08 noneKingston $ 15,075 $ 11,437 $ 11,437 $ 6,771 $ 9,590 $ 12.60 $ 7.31Ottawa $ 15,752 $ 11,808 $ 11,808 $ 7,345 $ 9,560 $ 12.14 $ 7.35Eastern Average $ 9,459 $ 7,013 $ 7,013 $ 4,330 $ 5,874 $ 6.14 $ 5.01SingleDetachedDwellingsper unitSt. Marys 2,641Chatham-Kent 3,266Central Elgin 4,733Middlesex Centre 5,210Sarnia 5,643Kingsville 5,915Meaford 6,392St. Thomas 6,857Lambton Shores 9,985Tecumseh 11,844Leamington 12,906Stratford 13,265Wellesley 13,740<strong>Brantford</strong> 14,661Windsor 16,378North Dumfries 16,113Tillsonburg 16,453Woolwich 18,113Wilmot 19,998London 22,599Kitchener 23,149The Blue Mountains 23,630Cambridge 25,311Guelph 25,615Waterloo 27,730MultiplesDwelling3+ per unitMultiplesDwelling1&2 perunitApartmentunits < 2per unitApartmentunits >=2per unitNonResidentialCommercialper sq. ft.NonResidentialIndustrial persq. ft.$ $ 1,954 $ 1,954 $ 1,069 $ 1,649 none none$ $ 2,483 $ 2,483 $ 1,247 $ 2,449 $ 3.30 $ 1.47$ $ 3,623 $ 3,623 $ 2,677 $ 2,677 $ 2.34 none$ $ 3,653 $ 3,653 $ 2,271 $ 3,003 $ 1.00 $ 0.40$ $ 4,239 $ 4,239 $ 2,535 $ 3,554 $ 4.38 $ 4.38$ $ 4,856 $ 4,856 $ 2,748 $ 4,032 $ 0.88 $ 0.88$ $ 5,576 $ 5,576 $ 5,576 $ 5,576 $ 1.32 $ 0.53$ $ 5,576 $ 5,576 $ 2,886 $ 4,319 $ 5.32 $ 2.03$ $ 8,593 $ 8,593 $ 4,496 $ 6,365 $ 5.48 $ 5.48$ $ 8,642 $ 8,642 $ 5,512 $ 7,077 $ 4.71 $ 3.28$ $ 8,793 $ 8,793 $ 5,607 $ 7,202 $ 1.05 $ 1.05$ $ 9,795 $ 9,795 $ 5,230 $ 7,604 $ 2.08 none$ $ 10,113 $ 10,113 $ 8,643 $ 8,643 $ 9.81 $ 9.81$ $ 10,228 $ 10,228 $ 7,026 $ 7,943 $ 5.00 $ 5.00$ $ 12,726 $ 12,726 $ 8,515 $ 8,515 $ 3.50 none$ $ 12,486 $ 12,486 $ 11,016 $ 11,016 $ 9.81 $ 9.81$ $ 13,807 $ 13,807 $ 7,508 $ 10,022 $ 3.39 none$ $ 13,625 $ 13,625 $ 10,775 $ 11,403 $ 11.42 $ 11.42$ $ 15,326 $ 15,326 $ 11,612 $ 13,856 $ 12.86 $ 11.34$ $ 16,317 $ 16,317 $ 9,835 $ 13,630 $ 15.19 none$ $ 16,615 $ 16,615 $ 13,978 $ 13,978 $ 14.27 $ 14.27$ $ 23,630 $ 23,630$ 11.40 $ 11.40$ $ 21,586 $ 21,586 $ 15,813 $ 15,813 $ 11.90 $ 11.90$ $ 19,933 $ 19,933 $ 12,259 $ 16,448 $ 11.72 $ 5.79$ $ 19,847 $ 19,847 $ 15,196 $ 17,107 $ 15.04 $ 15.04Southwest Average $ 14,086 $ 10,961 $ 10,961 $ 7,251 $ 8,495 $ 6.97 $ 6.59User Fees & Revenue Information166
SingleDetachedDwellingsper unitToronto 14,569Oshawa 29,109Pickering 31,918Whitby 32,893Ajax 33,874Mississauga 35,265Clarington 35,893Burlington 36,371Caledon 37,967Georgina 38,262Halton Hills 42,418Brampton 43,129East Gwillimbury 44,921Milton 45,143King 45,299Richmond Hill 45,433Whitchurch-Stouffville 46,010Vaughan 46,242Oakville 47,249Newmarket 47,339Aurora 48,798Markham 52,892<strong>2011</strong> Development Charges—Grouped by LocationGTA <strong>Municipal</strong>itiesMultiples MultiplesDwelling Dwelling 1&23+ per unit per unitApartmentunits < 2per unitApartmentunits >=2per unit$ $ 11,784 $ 11,784 $ 6,367 $ 9,584 10.61$ $ 23,857 $ 23,857 $ 12,118 $ 18,780 21.41$ $ 25,499 $ 25,499 $ 13,256 $ 19,046 22.41$ $ 27,389 $ 27,389 $ 13,497 $ 21,312 18.50$ $ 27,661 $ 27,661 $ 13,632 $ 20,222 21.90$ $ 35,265 $ 35,265 $ 14,672 $ 26,591 14.95$ $ 30,353 $ 23,989 $ 14,886 $ 22,942 24.07$ $ 28,833 $ 22,085 $ 16,373 $ 21,822 20.86$ $ 33,866 $ 33,866 $ 15,582 $ 26,724 13.30$ $ 32,595 $ 32,595 $ 16,916 $ 24,882 38.72$ $ 34,828 $ 24,820 $ 18,087 $ 24,592 18.93$ $ 39,019 $ 39,019 $ 17,208 $ 14,359 13.21$ $ 37,514 $ 37,514 $ 19,282 $ 28,284 30.24$ $ 36,134 $ 36,134 $ 19,933 $ 28,105 22.22$ $ 38,090 $ 38,090 $ 19,322 $ 28,356 31.15$ $ 37,726 $ 37,726 $ 19,798 $ 28,849 30.99$ $ 37,905 $ 37,905 $ 20,635 $ 29,928 36.42$ $ 38,840 $ 38,840 $ 22,160 $ 29,214 29.09$ $ 37,502 $ 31,882 $ 20,003 $ 29,697 19.52$ $ 38,115 $ 29,159 $ 18,780 $ 27,692 28.90$ $ 40,136 $ 40,136 $ 21,622 $ 30,916 29.56$ $ 43,326 $ 43,326 $ 21,915 $ 33,631 28.11<strong>Municipal</strong> <strong>Study</strong> <strong>2011</strong>NonResidentialNonResidentialCommercial Industrial perper sq. ft. sq. ft.$ $ 0.58$ $ 4.75$ $ 8.66$ $ 4.75$ $ 8.15$ $ 11.28$ $ 7.58$ $ 16.29$ $ 10.77$ $ 16.03$ $ 15.35$ $ 10.68$ $ 17.55$ $ 19.92$ $ 18.46$ $ 20.61$ $ 17.72$ $ 16.40$ $ 19.52$ $ 16.21$ $ 16.87$ $ 15.35GTA Average $ 40,045 $ 33,465 $ 31,752 $ 17,093 $ 24,797 $ 23.87 $ 13.34Summary by Geographic LocationThere are clear trends across Ontario in terms <strong>of</strong> the DC practices and costs, with the lowest DCsgenerally in the North and East and the highest DCs in the GTA6 <strong>of</strong> the 8 North municipalities in the study do not have Development ChargesBrockville and Cornwall in the Eastern Ontario municipalities have no DCs. Of the remainingEastern municipalities, 2 exempt Industrial propertiesAll Niagara/Hamilton municipalities charge DCs for all types <strong>of</strong> properties6 <strong>of</strong> the Southwest municipalities exempt industrial properties from DCs to promote employmentUser Fees & Revenue Information167
- Page 5 and 6:
Municipal Study 2011Executive Summa
- Page 7 and 8:
Municipal Study 2011BrantfordSurvey
- Page 9 and 10:
Municipal Study 20112011 Comparison
- Page 11 and 12:
Municipal Study 2011SECTION 1: Intr
- Page 13 and 14:
Municipal Study 2011Age and Conditi
- Page 15 and 16:
Municipal Study 2011Asset Consumpti
- Page 17 and 18:
Municipal Study 2011Net municipal l
- Page 19 and 20:
Municipal Study 2011SECTION 7: Comp
- Page 21 and 22:
Municipal Study 2011SECTION 8: Comp
- Page 23 and 24:
Municipal Study 2011Introduction1
- Page 25 and 26:
Municipal Study 2011Municipal Study
- Page 27 and 28:
Municipal Study 2011Municipalities
- Page 29 and 30:
Municipal Study 2011Socio Economic
- Page 31 and 32:
Municipal Study 2011Population Stat
- Page 33 and 34:
Municipal Study 2011Simcoe/Muskoka/
- Page 35 and 36:
Municipal Study 2011Niagara/Hamilto
- Page 37 and 38:
Municipal Study 2011Northern——%
- Page 39 and 40:
Municipal Study 2011Ontario Populat
- Page 41 and 42:
Municipal Study 2011Age Demographic
- Page 43 and 44:
Municipal Study 2011% of Dwellings
- Page 45 and 46:
Municipal Study 2011Average Househo
- Page 47 and 48:
Municipal Study 2011Land Area and D
- Page 49 and 50:
Municipal Study 2011Land Area and D
- Page 51 and 52:
Municipal Study 2011Assessment Per
- Page 53 and 54:
Municipal Study 2011Taxable Assessm
- Page 55 and 56:
Municipal Study 2011Unweighted Asse
- Page 57 and 58:
Unweighted Assessment Composition (
- Page 59 and 60:
Municipal Study 2011Unweighted Asse
- Page 61 and 62:
Municipal Study 2011Top 10 Municipa
- Page 63 and 64:
Municipal Study 20112011 Shift In T
- Page 65 and 66:
Municipal Study 2011Building Permit
- Page 67 and 68:
Municipal Study 2011Municipal Finan
- Page 69 and 70:
Municipal Study 2011Evaluating a Mu
- Page 71 and 72:
Financial Position Per Capita—Tre
- Page 73 and 74:
Municipal Study 2011Operating Surpl
- Page 75 and 76:
Municipal Study 20112010 Operating
- Page 77 and 78:
Municipal Study 2011ReservesReserve
- Page 79 and 80:
Municipal Study 2011Discretionary R
- Page 81 and 82:
Municipal Study 2011Tax Debt Intere
- Page 83 and 84:
Municipal Study 2011Debt To Reserve
- Page 85 and 86:
Municipal Study 2011Debt Outstandin
- Page 87 and 88:
Municipal Study 2011Net Financial L
- Page 89 and 90:
Municipal Study 2011Revenue and Exp
- Page 91 and 92:
Municipal Study 2011Environmental S
- Page 93 and 94:
Municipal Study 2011Net Municipal L
- Page 95 and 96:
Municipal Study 20112011 Net Munici
- Page 97 and 98:
Municipal Study 2011Net Municipal L
- Page 99 and 100:
Municipal Study 2011Net Municipal L
- Page 101 and 102:
Municipal Study 20112011 Net Munici
- Page 103 and 104:
Municipal Study 20112011 Net Munici
- Page 105 and 106:
General Government(Sorted by Net Co
- Page 107 and 108:
Municipal Study 2011FireThe goal of
- Page 109 and 110:
Municipal Study 2011Fire Statistics
- Page 111 and 112:
Municipal Study 2011Fire Costs (con
- Page 113 and 114:
Municipal Study 2011Police(Sorted b
- Page 115 and 116:
Municipal Study 2011Court Security
- Page 117 and 118:
Municipal Study 2011Protective Insp
- Page 119 and 120:
Municipal Study 2011Roads ServicesA
- Page 121 and 122:
Municipal Study 2011Roadways—Pave
- Page 123 and 124:
Municipal Study 2011Roadways—Pave
- Page 125 and 126:
Roadways—Bridges and Culverts(Sor
- Page 127 and 128:
Roadways—Traffic Operations(Sorte
- Page 129 and 130:
Winter Control—Except Sidewalks,
- Page 131 and 132:
Winter Control—Sidewalks, Parking
- Page 133 and 134:
Municipal Study 2011Transit Service
- Page 135 and 136:
Municipal Study 2011ParkingParking
- Page 137 and 138: Street Lighting(Sorted by Net Costs
- Page 139 and 140: Storm Sewer - Urban(Sorted by Net C
- Page 141 and 142: Storm Sewer - Rural(Sorted by Net C
- Page 143 and 144: Waste Collection(Sorted by Net Cost
- Page 145 and 146: Waste Diversion(Sorted by Net Costs
- Page 147 and 148: Public Health Services(Sorted by Ne
- Page 149 and 150: Municipal Study 2011Ambulance Servi
- Page 151 and 152: Municipal Study 2011Emergency Measu
- Page 153 and 154: Municipal Study 2011General Assista
- Page 155 and 156: Assistance to the Aged(Sorted by Ne
- Page 157 and 158: Municipal Study 2011Social HousingS
- Page 159 and 160: Municipal Study 2011Social Housing(
- Page 161 and 162: Social Housing(Sorted by Total Net
- Page 163 and 164: Parks(Sorted by Net Costs per $100,
- Page 165 and 166: Municipal Study 2011Sports and Recr
- Page 167 and 168: Recreation Programming Cont’d(Sor
- Page 169 and 170: Recreation Facilities—Other(sorte
- Page 171 and 172: Recreation Facilities and Programmi
- Page 173 and 174: Municipal Study 2011LibraryPARTNERI
- Page 175 and 176: Municipal Study 2011Library (cont
- Page 177 and 178: Municipal Study 2011Cultural Servic
- Page 179 and 180: Municipal Study 2011PlanningMunicip
- Page 181 and 182: Commercial and Industrial(Sorted by
- Page 183 and 184: Municipal Study 2011User FeesAnalyz
- Page 185 and 186: Municipal Study 2011SingleDetachedD
- Page 187: 2011 Development Charges—Grouped
- Page 191 and 192: 2011 Building Permit Fees (sorted a
- Page 193 and 194: 2011 Building Permit Fees (sorted b
- Page 195 and 196: Municipal Study 20112011 Transit Fa
- Page 197 and 198: Municipal Study 2011Tax PoliciesThe
- Page 199 and 200: Municipal Study 2011Multi-Residenti
- Page 201 and 202: Municipal Study 2011Industrial (res
- Page 203 and 204: Municipal Study 2011New Multi-Resid
- Page 205 and 206: Municipal Study 2011Comparison of R
- Page 207 and 208: Municipal Study 2011General Introdu
- Page 209 and 210: Municipal Study 20112011 Total Prop
- Page 211 and 212: Municipal Study 20112011 Education
- Page 213 and 214: 2011 Municipal Rates (Upper and Low
- Page 215 and 216: Municipal Study 2011Presentation of
- Page 217 and 218: Municipal Study 2011Residential Com
- Page 219 and 220: Municipal Study 2011Residential Com
- Page 221 and 222: Municipal Study 2011Residential Com
- Page 223 and 224: Municipal Study 2011Residential Com
- Page 225 and 226: Municipal Study 2011Residential Com
- Page 227 and 228: Municipal Study 2011Residential Com
- Page 229 and 230: Municipal Study 2011Residential Com
- Page 231 and 232: Multi-Residential Walk-Ups(taxes ca
- Page 233 and 234: Municipal Study 2011Multi-Residenti
- Page 235 and 236: Multi-Residential Comparisons - Wal
- Page 237 and 238: Municipal Study 2011Multi-Residenti
- Page 239 and 240:
Municipal Study 2011Multi-Residenti
- Page 241 and 242:
Municipal Study 2011Multi-Residenti
- Page 243 and 244:
Municipal Study 2011Multi-Residenti
- Page 245 and 246:
Commercial Comparisons - Office Bui
- Page 247 and 248:
Municipal Study 2011Commercial Comp
- Page 249 and 250:
Municipal Study 2011Commercial Comp
- Page 251 and 252:
Municipal Study 2011Commercial Comp
- Page 253 and 254:
Commercial Comparisons - Neighbourh
- Page 255 and 256:
Municipal Study 2011Commercial Comp
- Page 257 and 258:
Municipal Study 2011Commercial Comp
- Page 259 and 260:
Municipal Study 2011Commercial Comp
- Page 261 and 262:
Municipal Study 2011Commercial Comp
- Page 263 and 264:
Municipal Study 2011Commercial Comp
- Page 265 and 266:
Commercial Comparisons - Hotel—by
- Page 267 and 268:
Commercial Comparisons - Hotel—by
- Page 269 and 270:
Municipal Study 2011Commercial Comp
- Page 271 and 272:
Commercial Comparisons - Motel—by
- Page 273 and 274:
Municipal Study 2011Commercial Comp
- Page 275 and 276:
Commercial Comparisons - Motel—by
- Page 277 and 278:
Municipal Study 2011Commercial Summ
- Page 279 and 280:
Commercial Comparisons - Summary (c
- Page 281 and 282:
Municipal Study 2011Industrial Comp
- Page 283 and 284:
Municipal Study 2011Standard Indust
- Page 285 and 286:
Municipal Study 2011$3.00Standard I
- Page 287 and 288:
Municipal Study 2011Standard Indust
- Page 289 and 290:
Municipal Study 2011Large Industria
- Page 291 and 292:
Municipal Study 2011Large Industria
- Page 293 and 294:
Municipal Study 2011Large Industria
- Page 295 and 296:
Municipal Study 2011Large Industria
- Page 297 and 298:
Industrial Comparisons - Industrial
- Page 299 and 300:
Municipal Study 2011Industrial Comp
- Page 301 and 302:
Municipal Study 2011Industrial Comp
- Page 303 and 304:
Municipal Study 2011Industrial Comp
- Page 305 and 306:
Municipal Study 2011Industrial Summ
- Page 307 and 308:
Municipal Study 2011Industrial Summ
- Page 309 and 310:
Municipal Study 2011Water/Wastewate
- Page 311 and 312:
Municipal Study 2011Water and Waste
- Page 313 and 314:
Municipal Study 2011Comparison of R
- Page 315 and 316:
Municipal Study 2011Comparison of T
- Page 317 and 318:
Municipal Study 2011Comparison of W
- Page 319 and 320:
Municipal Study 2011Comparison of W
- Page 321 and 322:
Municipal Study 2011Comparison of W
- Page 323 and 324:
Water/Wastewater Costs as a Percent
- Page 325 and 326:
Municipal Study 2011Water and Waste
- Page 327 and 328:
Municipal Study 2011Water and Waste
- Page 329 and 330:
Municipal Study 2011Wastewater Oper
- Page 331 and 332:
Municipal Study 2011Wastewater Asse
- Page 333 and 334:
Municipal Study 2011Water Reserves
- Page 335 and 336:
Municipal Study 2011Wastewater Rese
- Page 337 and 338:
Municipal Study 2011Wastewater Debt
- Page 339 and 340:
Municipal Study 2011Water Net Finan
- Page 341 and 342:
Municipal Study 2011Wastewater Net
- Page 343 and 344:
Municipal Study 2011Water MPMPs Con
- Page 345 and 346:
Municipal Study 2011Wastewater MPMP
- Page 347 and 348:
Municipal Study 2011Taxes and Water
- Page 349 and 350:
Average Household Income and Dwelli
- Page 351 and 352:
Property Taxes as a Percentage of I
- Page 353 and 354:
Municipal Study 2011Total Municipal
- Page 355 and 356:
Municipal Study 2011Total Municipal
- Page 357 and 358:
Municipal Study 2011Economic Develo
- Page 359 and 360:
Municipal Study 2011Section 4 of th
- Page 361 and 362:
Municipal Study 2011Business Retent
- Page 363 and 364:
Municipal Study 2011Business Retent
- Page 365 and 366:
Municipal Study 2011Business Retent
- Page 367 and 368:
Municipal Study 2011Business Retent
- Page 369 and 370:
Municipal Study 2011Business Retent
- Page 371 and 372:
Municipal Study 2011Business Retent
- Page 373 and 374:
Municipal Study 2011Business Retent
- Page 375 and 376:
Municipal Study 2011Business Retent
- Page 377 and 378:
Municipal Study 2011Business Retent
- Page 379 and 380:
Municipal Study 2011Business Retent
- Page 381 and 382:
Municipal Study 2011Business Retent
- Page 383 and 384:
Municipal Study 2011Business Retent
- Page 385 and 386:
Municipal Study 2011Downtown/Area S
- Page 387 and 388:
Municipal Study 2011Downtown/Area S
- Page 389 and 390:
Municipal Study 2011Downtown/Area S
- Page 391 and 392:
Municipal Study 2011MunicipalityCor
- Page 393 and 394:
Municipal Study 2011MunicipalityKit
- Page 395 and 396:
Municipal Study 2011Downtown/Area S
- Page 397 and 398:
Municipal Study 2011Downtown/Area S
- Page 399 and 400:
Municipal Study 2011Downtown/Area S
- Page 401 and 402:
Municipal Study 2011WellandWhitbyWh
- Page 403 and 404:
Municipal Study 2011Brownfield Rede
- Page 405 and 406:
Municipal Study 2011Brownfield Rede
- Page 407 and 408:
Municipal Study 2011Brownfield Rede
- Page 409 and 410:
Industrial ParksMunicipal Study 201
- Page 411:
Industrial ParksMunicipal Study 201