<strong>Municipal</strong> <strong>Study</strong> <strong>2011</strong>Total <strong>Municipal</strong> and Property Tax Burden as a Percentage <strong>of</strong> IncomeThe following table includes water and sewer costs on a typical home and calculates the total municipalburden as a % <strong>of</strong> household income.<strong>Municipal</strong>ity <strong>2011</strong> Est.Avg.HouseholdIncome<strong>2011</strong>AverageResidentialTaxes<strong>2011</strong>ResidentialWater/WWCosts<strong>2011</strong> Total<strong>Municipal</strong>Tax Burden<strong>2011</strong> Total<strong>Municipal</strong>Burden as a% <strong>of</strong>HouseholdIncome<strong>2011</strong>RelativeRanking% <strong>of</strong>IncomeKingsville mid $ 2,350 $ 527 $ 2,877 3.4% lowTecumseh high $ 2,925 $ 752 $ 3,677 3.4% lowMilton high $ 3,208 $ 709 $ 3,917 3.5% lowAurora high $ 4,551 $ 640 $ 5,191 3.6% lowWoolwich high $ 3,448 $ 1,110 $ 4,557 3.6% lowCaledon high $ 4,441 $ 355 $ 4,796 3.7% lowHalton Hills high $ 3,688 $ 709 $ 4,397 3.7% lowKing high $ 6,178 $ 772 $ 6,949 3.8% lowFort Frances mid $ 2,289 $ 801 $ 3,090 3.8% lowWhitchurch-Stouffville high $ 4,651 $ 625 $ 5,276 3.9% lowOakville high $ 5,019 $ 709 $ 5,728 4.0% lowEast Gwillimbury high $ 4,117 $ 775 $ 4,892 4.0% lowMississauga high $ 3,687 $ 355 $ 4,042 4.0% lowBurlington high $ 3,672 $ 709 $ 4,380 4.0% lowMiddlesex Centre high $ 3,499 $ 1,205 $ 4,704 4.1% lowMarkham high $ 4,189 $ 604 $ 4,793 4.2% lowNewmarket high $ 3,940 $ 801 $ 4,741 4.2% lowVaughan high $ 4,702 $ 602 $ 5,304 4.3% lowKenora mid $ 2,421 $ 919 $ 3,340 4.4% lowNorth Dumfries high $ 3,629 $ 826 $ 4,455 4.4% lowGrimsby high $ 3,966 $ 498 $ 4,464 4.5% lowBrampton mid $ 3,910 $ 355 $ 4,265 4.5% lowClarington high $ 3,708 $ 701 $ 4,409 4.5% lowToronto mid $ 3,492 $ 571 $ 4,063 4.6% lowWaterloo high $ 3,796 $ 802 $ 4,597 4.6% lowWilmot high $ 3,498 $ 879 $ 4,378 4.6% lowRichmond Hill high $ 4,593 $ 612 $ 5,205 4.7% lowPelham high $ 4,168 $ 804 $ 4,972 4.7% lowWhitby high $ 4,286 $ 701 $ 4,987 4.7% lowLeamington mid $ 3,031 $ 741 $ 3,772 4.7% lowSarnia mid $ 2,884 $ 919 $ 3,804 4.8% midOttawa high $ 3,793 $ 748 $ 4,541 4.8% midLondon mid $ 2,909 $ 771 $ 3,680 4.8% midPickering high $ 4,454 $ 701 $ 5,155 4.8% midTimmins mid $ 2,920 $ 638 $ 3,558 4.8% midAjax high $ 4,224 $ 701 $ 4,925 4.8% midCambridge mid $ 3,326 $ 845 $ 4,171 4.9% midSt. Thomas low $ 2,627 $ 804 $ 3,431 4.9% midKitchener mid $ 3,149 $ 825 $ 3,974 5.0% midBrockville low $ 2,766 $ 589 $ 3,355 5.0% midSault Ste. Marie low $ 2,700 $ 681 $ 3,381 5.0% midGuelph mid $ 3,457 $ 794 $ 4,251 5.0% midQuinte West low $ 2,544 $ 627 $ 3,171 5.1% midTaxes as a % <strong>of</strong> Income330
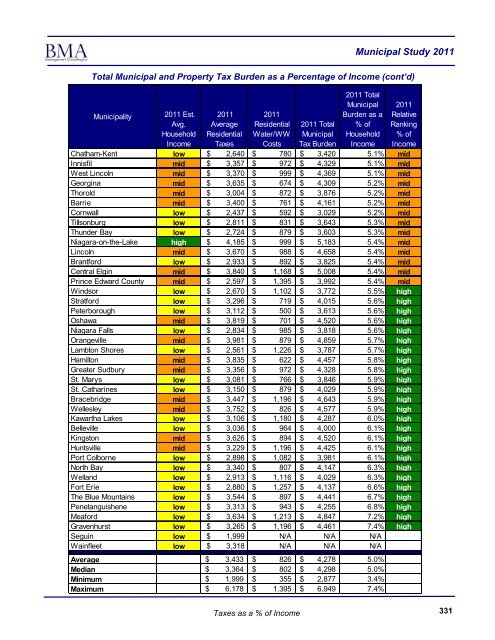
<strong>Municipal</strong> <strong>Study</strong> <strong>2011</strong>Total <strong>Municipal</strong> and Property Tax Burden as a Percentage <strong>of</strong> Income (cont’d)<strong>Municipal</strong>ity <strong>2011</strong> Est.Avg.HouseholdIncome<strong>2011</strong>AverageResidentialTaxes<strong>2011</strong>ResidentialWater/WWCosts<strong>2011</strong> Total<strong>Municipal</strong>Tax Burden<strong>2011</strong> Total<strong>Municipal</strong>Burden as a% <strong>of</strong>HouseholdIncome<strong>2011</strong>RelativeRanking% <strong>of</strong>IncomeChatham-Kent low $ 2,640 $ 780 $ 3,420 5.1% midInnisfil mid $ 3,357 $ 972 $ 4,329 5.1% midWest Lincoln mid $ 3,370 $ 999 $ 4,369 5.1% midGeorgina mid $ 3,635 $ 674 $ 4,309 5.2% midThorold mid $ 3,004 $ 872 $ 3,876 5.2% midBarrie mid $ 3,400 $ 761 $ 4,161 5.2% midCornwall low $ 2,437 $ 592 $ 3,029 5.2% midTillsonburg low $ 2,811 $ 831 $ 3,643 5.3% midThunder Bay low $ 2,724 $ 879 $ 3,603 5.3% midNiagara-on-the-Lake high $ 4,185 $ 999 $ 5,183 5.4% midLincoln mid $ 3,670 $ 988 $ 4,658 5.4% mid<strong>Brantford</strong> low $ 2,933 $ 892 $ 3,825 5.4% midCentral Elgin mid $ 3,840 $ 1,168 $ 5,008 5.4% midPrince Edward County mid $ 2,597 $ 1,395 $ 3,992 5.4% midWindsor low $ 2,670 $ 1,102 $ 3,772 5.5% highStratford low $ 3,296 $ 719 $ 4,015 5.6% highPeterborough low $ 3,112 $ 500 $ 3,613 5.6% highOshawa mid $ 3,819 $ 701 $ 4,520 5.6% highNiagara Falls low $ 2,834 $ 985 $ 3,818 5.6% highOrangeville mid $ 3,981 $ 879 $ 4,859 5.7% highLambton Shores low $ 2,561 $ 1,226 $ 3,787 5.7% highHamilton mid $ 3,835 $ 622 $ 4,457 5.8% highGreater Sudbury mid $ 3,356 $ 972 $ 4,328 5.8% highSt. Marys low $ 3,081 $ 766 $ 3,846 5.9% highSt. Catharines low $ 3,150 $ 879 $ 4,029 5.9% highBracebridge mid $ 3,447 $ 1,196 $ 4,643 5.9% highWellesley mid $ 3,752 $ 826 $ 4,577 5.9% highKawartha Lakes low $ 3,106 $ 1,180 $ 4,287 6.0% highBelleville low $ 3,036 $ 964 $ 4,000 6.1% highKingston mid $ 3,626 $ 894 $ 4,520 6.1% highHuntsville mid $ 3,229 $ 1,196 $ 4,425 6.1% highPort Colborne low $ 2,898 $ 1,082 $ 3,981 6.1% highNorth Bay low $ 3,340 $ 807 $ 4,147 6.3% highWelland low $ 2,913 $ 1,116 $ 4,029 6.3% highFort Erie low $ 2,880 $ 1,257 $ 4,137 6.6% highThe Blue Mountains low $ 3,544 $ 897 $ 4,441 6.7% highPenetanguishene low $ 3,313 $ 943 $ 4,255 6.8% highMeaford low $ 3,634 $ 1,213 $ 4,847 7.2% highGravenhurst low $ 3,265 $ 1,196 $ 4,461 7.4% highSeguin low $ 1,999 N/A N/A N/AWainfleet low $ 3,318 N/A N/A N/AAverage $ 3,433 $ 826 $ 4,278 5.0%Median $ 3,364 $ 802 $ 4,298 5.0%Minimum $ 1,999 $ 355 $ 2,877 3.4%Maximum $ 6,178 $ 1,395 $ 6,949 7.4%Taxes as a % <strong>of</strong> Income331
- Page 5 and 6:
Municipal Study 2011Executive Summa
- Page 7 and 8:
Municipal Study 2011BrantfordSurvey
- Page 9 and 10:
Municipal Study 20112011 Comparison
- Page 11 and 12:
Municipal Study 2011SECTION 1: Intr
- Page 13 and 14:
Municipal Study 2011Age and Conditi
- Page 15 and 16:
Municipal Study 2011Asset Consumpti
- Page 17 and 18:
Municipal Study 2011Net municipal l
- Page 19 and 20:
Municipal Study 2011SECTION 7: Comp
- Page 21 and 22:
Municipal Study 2011SECTION 8: Comp
- Page 23 and 24:
Municipal Study 2011Introduction1
- Page 25 and 26:
Municipal Study 2011Municipal Study
- Page 27 and 28:
Municipal Study 2011Municipalities
- Page 29 and 30:
Municipal Study 2011Socio Economic
- Page 31 and 32:
Municipal Study 2011Population Stat
- Page 33 and 34:
Municipal Study 2011Simcoe/Muskoka/
- Page 35 and 36:
Municipal Study 2011Niagara/Hamilto
- Page 37 and 38:
Municipal Study 2011Northern——%
- Page 39 and 40:
Municipal Study 2011Ontario Populat
- Page 41 and 42:
Municipal Study 2011Age Demographic
- Page 43 and 44:
Municipal Study 2011% of Dwellings
- Page 45 and 46:
Municipal Study 2011Average Househo
- Page 47 and 48:
Municipal Study 2011Land Area and D
- Page 49 and 50:
Municipal Study 2011Land Area and D
- Page 51 and 52:
Municipal Study 2011Assessment Per
- Page 53 and 54:
Municipal Study 2011Taxable Assessm
- Page 55 and 56:
Municipal Study 2011Unweighted Asse
- Page 57 and 58:
Unweighted Assessment Composition (
- Page 59 and 60:
Municipal Study 2011Unweighted Asse
- Page 61 and 62:
Municipal Study 2011Top 10 Municipa
- Page 63 and 64:
Municipal Study 20112011 Shift In T
- Page 65 and 66:
Municipal Study 2011Building Permit
- Page 67 and 68:
Municipal Study 2011Municipal Finan
- Page 69 and 70:
Municipal Study 2011Evaluating a Mu
- Page 71 and 72:
Financial Position Per Capita—Tre
- Page 73 and 74:
Municipal Study 2011Operating Surpl
- Page 75 and 76:
Municipal Study 20112010 Operating
- Page 77 and 78:
Municipal Study 2011ReservesReserve
- Page 79 and 80:
Municipal Study 2011Discretionary R
- Page 81 and 82:
Municipal Study 2011Tax Debt Intere
- Page 83 and 84:
Municipal Study 2011Debt To Reserve
- Page 85 and 86:
Municipal Study 2011Debt Outstandin
- Page 87 and 88:
Municipal Study 2011Net Financial L
- Page 89 and 90:
Municipal Study 2011Revenue and Exp
- Page 91 and 92:
Municipal Study 2011Environmental S
- Page 93 and 94:
Municipal Study 2011Net Municipal L
- Page 95 and 96:
Municipal Study 20112011 Net Munici
- Page 97 and 98:
Municipal Study 2011Net Municipal L
- Page 99 and 100:
Municipal Study 2011Net Municipal L
- Page 101 and 102:
Municipal Study 20112011 Net Munici
- Page 103 and 104:
Municipal Study 20112011 Net Munici
- Page 105 and 106:
General Government(Sorted by Net Co
- Page 107 and 108:
Municipal Study 2011FireThe goal of
- Page 109 and 110:
Municipal Study 2011Fire Statistics
- Page 111 and 112:
Municipal Study 2011Fire Costs (con
- Page 113 and 114:
Municipal Study 2011Police(Sorted b
- Page 115 and 116:
Municipal Study 2011Court Security
- Page 117 and 118:
Municipal Study 2011Protective Insp
- Page 119 and 120:
Municipal Study 2011Roads ServicesA
- Page 121 and 122:
Municipal Study 2011Roadways—Pave
- Page 123 and 124:
Municipal Study 2011Roadways—Pave
- Page 125 and 126:
Roadways—Bridges and Culverts(Sor
- Page 127 and 128:
Roadways—Traffic Operations(Sorte
- Page 129 and 130:
Winter Control—Except Sidewalks,
- Page 131 and 132:
Winter Control—Sidewalks, Parking
- Page 133 and 134:
Municipal Study 2011Transit Service
- Page 135 and 136:
Municipal Study 2011ParkingParking
- Page 137 and 138:
Street Lighting(Sorted by Net Costs
- Page 139 and 140:
Storm Sewer - Urban(Sorted by Net C
- Page 141 and 142:
Storm Sewer - Rural(Sorted by Net C
- Page 143 and 144:
Waste Collection(Sorted by Net Cost
- Page 145 and 146:
Waste Diversion(Sorted by Net Costs
- Page 147 and 148:
Public Health Services(Sorted by Ne
- Page 149 and 150:
Municipal Study 2011Ambulance Servi
- Page 151 and 152:
Municipal Study 2011Emergency Measu
- Page 153 and 154:
Municipal Study 2011General Assista
- Page 155 and 156:
Assistance to the Aged(Sorted by Ne
- Page 157 and 158:
Municipal Study 2011Social HousingS
- Page 159 and 160:
Municipal Study 2011Social Housing(
- Page 161 and 162:
Social Housing(Sorted by Total Net
- Page 163 and 164:
Parks(Sorted by Net Costs per $100,
- Page 165 and 166:
Municipal Study 2011Sports and Recr
- Page 167 and 168:
Recreation Programming Cont’d(Sor
- Page 169 and 170:
Recreation Facilities—Other(sorte
- Page 171 and 172:
Recreation Facilities and Programmi
- Page 173 and 174:
Municipal Study 2011LibraryPARTNERI
- Page 175 and 176:
Municipal Study 2011Library (cont
- Page 177 and 178:
Municipal Study 2011Cultural Servic
- Page 179 and 180:
Municipal Study 2011PlanningMunicip
- Page 181 and 182:
Commercial and Industrial(Sorted by
- Page 183 and 184:
Municipal Study 2011User FeesAnalyz
- Page 185 and 186:
Municipal Study 2011SingleDetachedD
- Page 187 and 188:
2011 Development Charges—Grouped
- Page 189 and 190:
SingleDetachedDwellingsper unitToro
- Page 191 and 192:
2011 Building Permit Fees (sorted a
- Page 193 and 194:
2011 Building Permit Fees (sorted b
- Page 195 and 196:
Municipal Study 20112011 Transit Fa
- Page 197 and 198:
Municipal Study 2011Tax PoliciesThe
- Page 199 and 200:
Municipal Study 2011Multi-Residenti
- Page 201 and 202:
Municipal Study 2011Industrial (res
- Page 203 and 204:
Municipal Study 2011New Multi-Resid
- Page 205 and 206:
Municipal Study 2011Comparison of R
- Page 207 and 208:
Municipal Study 2011General Introdu
- Page 209 and 210:
Municipal Study 20112011 Total Prop
- Page 211 and 212:
Municipal Study 20112011 Education
- Page 213 and 214:
2011 Municipal Rates (Upper and Low
- Page 215 and 216:
Municipal Study 2011Presentation of
- Page 217 and 218:
Municipal Study 2011Residential Com
- Page 219 and 220:
Municipal Study 2011Residential Com
- Page 221 and 222:
Municipal Study 2011Residential Com
- Page 223 and 224:
Municipal Study 2011Residential Com
- Page 225 and 226:
Municipal Study 2011Residential Com
- Page 227 and 228:
Municipal Study 2011Residential Com
- Page 229 and 230:
Municipal Study 2011Residential Com
- Page 231 and 232:
Multi-Residential Walk-Ups(taxes ca
- Page 233 and 234:
Municipal Study 2011Multi-Residenti
- Page 235 and 236:
Multi-Residential Comparisons - Wal
- Page 237 and 238:
Municipal Study 2011Multi-Residenti
- Page 239 and 240:
Municipal Study 2011Multi-Residenti
- Page 241 and 242:
Municipal Study 2011Multi-Residenti
- Page 243 and 244:
Municipal Study 2011Multi-Residenti
- Page 245 and 246:
Commercial Comparisons - Office Bui
- Page 247 and 248:
Municipal Study 2011Commercial Comp
- Page 249 and 250:
Municipal Study 2011Commercial Comp
- Page 251 and 252:
Municipal Study 2011Commercial Comp
- Page 253 and 254:
Commercial Comparisons - Neighbourh
- Page 255 and 256:
Municipal Study 2011Commercial Comp
- Page 257 and 258:
Municipal Study 2011Commercial Comp
- Page 259 and 260:
Municipal Study 2011Commercial Comp
- Page 261 and 262:
Municipal Study 2011Commercial Comp
- Page 263 and 264:
Municipal Study 2011Commercial Comp
- Page 265 and 266:
Commercial Comparisons - Hotel—by
- Page 267 and 268:
Commercial Comparisons - Hotel—by
- Page 269 and 270:
Municipal Study 2011Commercial Comp
- Page 271 and 272:
Commercial Comparisons - Motel—by
- Page 273 and 274:
Municipal Study 2011Commercial Comp
- Page 275 and 276:
Commercial Comparisons - Motel—by
- Page 277 and 278:
Municipal Study 2011Commercial Summ
- Page 279 and 280:
Commercial Comparisons - Summary (c
- Page 281 and 282:
Municipal Study 2011Industrial Comp
- Page 283 and 284:
Municipal Study 2011Standard Indust
- Page 285 and 286:
Municipal Study 2011$3.00Standard I
- Page 287 and 288:
Municipal Study 2011Standard Indust
- Page 289 and 290:
Municipal Study 2011Large Industria
- Page 291 and 292:
Municipal Study 2011Large Industria
- Page 293 and 294:
Municipal Study 2011Large Industria
- Page 295 and 296:
Municipal Study 2011Large Industria
- Page 297 and 298:
Industrial Comparisons - Industrial
- Page 299 and 300:
Municipal Study 2011Industrial Comp
- Page 301 and 302: Municipal Study 2011Industrial Comp
- Page 303 and 304: Municipal Study 2011Industrial Comp
- Page 305 and 306: Municipal Study 2011Industrial Summ
- Page 307 and 308: Municipal Study 2011Industrial Summ
- Page 309 and 310: Municipal Study 2011Water/Wastewate
- Page 311 and 312: Municipal Study 2011Water and Waste
- Page 313 and 314: Municipal Study 2011Comparison of R
- Page 315 and 316: Municipal Study 2011Comparison of T
- Page 317 and 318: Municipal Study 2011Comparison of W
- Page 319 and 320: Municipal Study 2011Comparison of W
- Page 321 and 322: Municipal Study 2011Comparison of W
- Page 323 and 324: Water/Wastewater Costs as a Percent
- Page 325 and 326: Municipal Study 2011Water and Waste
- Page 327 and 328: Municipal Study 2011Water and Waste
- Page 329 and 330: Municipal Study 2011Wastewater Oper
- Page 331 and 332: Municipal Study 2011Wastewater Asse
- Page 333 and 334: Municipal Study 2011Water Reserves
- Page 335 and 336: Municipal Study 2011Wastewater Rese
- Page 337 and 338: Municipal Study 2011Wastewater Debt
- Page 339 and 340: Municipal Study 2011Water Net Finan
- Page 341 and 342: Municipal Study 2011Wastewater Net
- Page 343 and 344: Municipal Study 2011Water MPMPs Con
- Page 345 and 346: Municipal Study 2011Wastewater MPMP
- Page 347 and 348: Municipal Study 2011Taxes and Water
- Page 349 and 350: Average Household Income and Dwelli
- Page 351: Property Taxes as a Percentage of I
- Page 355 and 356: Municipal Study 2011Total Municipal
- Page 357 and 358: Municipal Study 2011Economic Develo
- Page 359 and 360: Municipal Study 2011Section 4 of th
- Page 361 and 362: Municipal Study 2011Business Retent
- Page 363 and 364: Municipal Study 2011Business Retent
- Page 365 and 366: Municipal Study 2011Business Retent
- Page 367 and 368: Municipal Study 2011Business Retent
- Page 369 and 370: Municipal Study 2011Business Retent
- Page 371 and 372: Municipal Study 2011Business Retent
- Page 373 and 374: Municipal Study 2011Business Retent
- Page 375 and 376: Municipal Study 2011Business Retent
- Page 377 and 378: Municipal Study 2011Business Retent
- Page 379 and 380: Municipal Study 2011Business Retent
- Page 381 and 382: Municipal Study 2011Business Retent
- Page 383 and 384: Municipal Study 2011Business Retent
- Page 385 and 386: Municipal Study 2011Downtown/Area S
- Page 387 and 388: Municipal Study 2011Downtown/Area S
- Page 389 and 390: Municipal Study 2011Downtown/Area S
- Page 391 and 392: Municipal Study 2011MunicipalityCor
- Page 393 and 394: Municipal Study 2011MunicipalityKit
- Page 395 and 396: Municipal Study 2011Downtown/Area S
- Page 397 and 398: Municipal Study 2011Downtown/Area S
- Page 399 and 400: Municipal Study 2011Downtown/Area S
- Page 401 and 402: Municipal Study 2011WellandWhitbyWh
- Page 403 and 404:
Municipal Study 2011Brownfield Rede
- Page 405 and 406:
Municipal Study 2011Brownfield Rede
- Page 407 and 408:
Municipal Study 2011Brownfield Rede
- Page 409 and 410:
Industrial ParksMunicipal Study 201
- Page 411:
Industrial ParksMunicipal Study 201