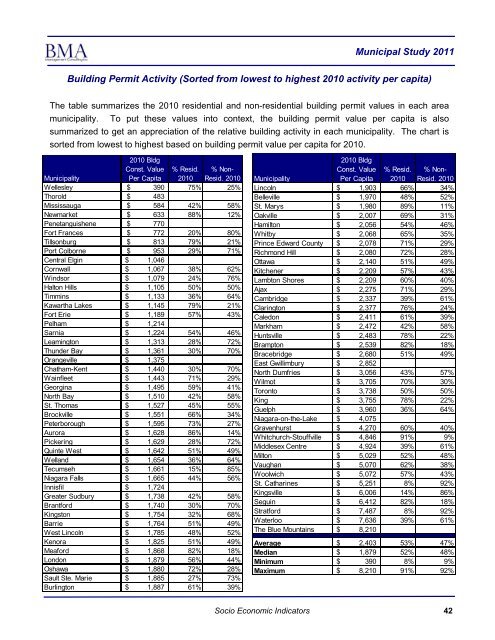
<strong>Municipal</strong> <strong>Study</strong> <strong>2011</strong>Building Permit Activity (Sorted from lowest to highest 2010 activity per capita)The table summarizes the 2010 residential and non-residential building permit values in each areamunicipality. To put these values into context, the building permit value per capita is alsosummarized to get an appreciation <strong>of</strong> the relative building activity in each municipality. The chart issorted from lowest to highest based on building permit value per capita for 2010.<strong>Municipal</strong>ity2010 BldgConst. ValuePer Capita% Resid.2010% Non-Resid. 2010Wellesley $ 390 75% 25%Thorold $ 483Mississauga $ 584 42% 58%Newmarket $ 633 88% 12%Penetanguishene $ 770Fort Frances $ 772 20% 80%Tillsonburg $ 813 79% 21%Port Colborne $ 953 29% 71%Central Elgin $ 1,046Cornwall $ 1,067 38% 62%Windsor $ 1,079 24% 76%Halton Hills $ 1,105 50% 50%Timmins $ 1,133 36% 64%Kawartha Lakes $ 1,145 79% 21%Fort Erie $ 1,189 57% 43%Pelham $ 1,214Sarnia $ 1,224 54% 46%Leamington $ 1,313 28% 72%Thunder Bay $ 1,361 30% 70%Orangeville $ 1,375Chatham-Kent $ 1,440 30% 70%Wainfleet $ 1,443 71% 29%Georgina $ 1,495 59% 41%North Bay $ 1,510 42% 58%St. Thomas $ 1,527 45% 55%Brockville $ 1,551 66% 34%Peterborough $ 1,595 73% 27%Aurora $ 1,628 86% 14%Pickering $ 1,629 28% 72%Quinte West $ 1,642 51% 49%Welland $ 1,654 36% 64%Tecumseh $ 1,661 15% 85%Niagara Falls $ 1,665 44% 56%Innisfil $ 1,724Greater Sudbury $ 1,738 42% 58%<strong>Brantford</strong> $ 1,740 30% 70%Kingston $ 1,754 32% 68%Barrie $ 1,764 51% 49%West Lincoln $ 1,785 48% 52%Kenora $ 1,825 51% 49%Meaford $ 1,868 82% 18%London $ 1,879 56% 44%Oshawa $ 1,880 72% 28%Sault Ste. Marie $ 1,885 27% 73%Burlington $ 1,887 61% 39%<strong>Municipal</strong>ity2010 BldgConst. ValuePer Capita% Resid.2010% Non-Resid. 2010Lincoln $ 1,903 66% 34%Belleville $ 1,970 48% 52%St. Marys $ 1,980 89% 11%Oakville $ 2,007 69% 31%Hamilton $ 2,056 54% 46%Whitby $ 2,068 65% 35%Prince Edward County $ 2,078 71% 29%Richmond Hill $ 2,080 72% 28%Ottawa $ 2,140 51% 49%Kitchener $ 2,209 57% 43%Lambton Shores $ 2,209 60% 40%Ajax $ 2,275 71% 29%Cambridge $ 2,337 39% 61%Clarington $ 2,377 76% 24%Caledon $ 2,411 61% 39%Markham $ 2,472 42% 58%Huntsville $ 2,483 78% 22%Brampton $ 2,539 82% 18%Bracebridge $ 2,680 51% 49%East Gwillimbury $ 2,852North Dumfries $ 3,056 43% 57%Wilmot $ 3,705 70% 30%Toronto $ 3,738 50% 50%King $ 3,755 78% 22%Guelph $ 3,960 36% 64%Niagara-on-the-Lake $ 4,075Gravenhurst $ 4,270 60% 40%Whitchurch-Stouffville $ 4,846 91% 9%Middlesex Centre $ 4,924 39% 61%Milton $ 5,029 52% 48%Vaughan $ 5,070 62% 38%Woolwich $ 5,072 57% 43%St. Catharines $ 5,251 8% 92%Kingsville $ 6,006 14% 86%Seguin $ 6,412 82% 18%Stratford $ 7,487 8% 92%Waterloo $ 7,636 39% 61%The Blue Mountains $ 8,210Average $ 2,403 53% 47%Median $ 1,879 52% 48%Minimum $ 390 8% 9%Maximum $ 8,210 91% 92%Socio Economic Indicators42
<strong>Municipal</strong> <strong>Study</strong> <strong>2011</strong>Building Permit Activity Trend (Grouped by Location)The table has been sorted by 2010 building construction value per capita by location. Whereinformation was available, 2 and 3 year averages have been included. The low, medium and high is aranking for the entire database. This provides an indication within each geographic area <strong>of</strong> therelative rankings across the entire survey.<strong>Municipal</strong>ity2008 BuildingConstructionValue ($000)2009 BuildingConstructionValue ($000)2010 BuildingConstructionValue ($000)2010 BldgConst. ValuePer Capita2010 perCapitaRanking%Resid.2010% Non-Resid.2010Cornwall $ 21,911 $ 94,299 $ 50,272 $ 1,067 low 38% 62%Kawartha Lakes $ 89,195 $ 92,205 $ 87,586 $ 1,145 low 79% 21%Brockville $ 22,473 $ 15,634 $ 35,502 $ 1,551 low 66% 34%Peterborough $ 124,664 $ 127,925 $ 124,664 $ 1,595 low 73% 27%Quinte West $ 79,622 $ 59,256 $ 71,747 $ 1,642 mid 51% 49%Kingston $ 253,449 $ 233,889 $ 219,922 $ 1,754 mid 32% 68%Belleville $ 54,070 $ 77,130 $ 99,544 $ 1,970 mid 48% 52%Prince Edward County $ 70,616 $ 55,521 $ 55,521 $ 2,078 mid 71% 29%Ottawa $ 1,724,174 $ 1,796,362 $ 1,919,015 $ 2,140 mid 51% 49%Eastern Average $ 1,660Mississauga $ 1,127,194 $ 640,508 $ 451,806 $ 584 low 42% 58%Newmarket $ 128,017 $ 157,408 $ 54,544 $ 633 low 88% 12%Halton Hills $ 140,806 $ 79,741 $ 70,273 $ 1,105 low 50% 50%Georgina $ 45,710 $ 79,041 $ 73,537 $ 1,495 low 59% 41%Aurora $ 249,001 $ 260,106 $ 89,527 $ 1,628 mid 86% 14%Pickering $ 140,892 $ 112,658 $ 158,494 $ 1,629 mid 28% 72%Oshawa $ 196,059 $ 321,601 $ 297,005 $ 1,880 mid 72% 28%Burlington $ 470,683 $ 300,953 $ 358,665 $ 1,887 mid 61% 39%Oakville $ 536,131 $ 347,224 $ 383,598 $ 2,007 mid 69% 31%Whitby $ 255,469 $ 202,636 $ 252,669 $ 2,068 mid 65% 35%Richmond Hill $ 259,300 $ 271,275 $ 393,751 $ 2,080 mid 72% 28%Ajax $ 221,050 $ 270,411 $ 224,922 $ 2,275 high 71% 29%Clarington $ 193,589 $ 132,166 $ 203,038 $ 2,377 high 76% 24%Caledon $ 188,410 $ 107,181 $ 158,229 $ 2,411 high 61% 39%Markham $ 788,689 $ 428,053 $ 758,903 $ 2,472 high 42% 58%Brampton $ 749,957 $ 422,443 $ 1,268,876 $ 2,539 high 82% 18%East Gwillimbury $ 23,300 $ 40,164 $ 70,000 $ 2,852 highToronto $ 5,899,802 $ 5,521,393 $ 10,167,238 $ 3,738 high 50% 50%King $ 34,758 $ 40,160 $ 85,550 $ 3,755 high 78% 22%Whitchurch-Stouffville $ 218,987 $ 201,240 $ 138,794 $ 4,846 high 91% 9%Milton $ 610,558 $ 405,679 $ 425,736 $ 5,029 high 52% 48%Vaughan $ 1,026,700 $ 1,049,926 $ 1,406,798 $ 5,070 high 62% 38%GTA Average $ 2,471Thorold $ 12,438 $ 397,595 $ 9,101 $ 483 lowPort Colborne $ 13,717 $ 27,021 $ 18,456 $ 953 low 29% 71%Fort Erie $ 35,964 $ 46,052 $ 36,935 $ 1,189 low 57% 43%Pelham $ 22,970 $ 17,498 $ 20,366 $ 1,214 lowWainfleet $ 6,078 $ 5,782 $ 9,839 $ 1,443 low 71% 29%Welland $ 36,443 $ 67,943 $ 86,510 $ 1,654 mid 36% 64%Niagara Falls $ 171,257 $ 142,571 $ 141,795 $ 1,665 mid 44% 56%West Lincoln $ 23,214 $ 16,121 $ 24,125 $ 1,785 mid 48% 52%Lincoln $ 45,845 $ 26,491 $ 42,723 $ 1,903 mid 66% 34%Hamilton $ 818,463 $ 692,402 $ 1,096,299 $ 2,056 mid 54% 46%Niagara-on-the-Lake $ 41,468 $ 38,540 $ 62,300 $ 4,075 highSt. Catharines $ 101,969 $ 137,989 $ 721,930 $ 5,251 high 8% 92%Grimsby $ 39,809 $ 46,199Niag./Ham. Average $ 1,973Socio Economic Indicators43
- Page 5 and 6:
Municipal Study 2011Executive Summa
- Page 7 and 8:
Municipal Study 2011BrantfordSurvey
- Page 9 and 10:
Municipal Study 20112011 Comparison
- Page 11 and 12:
Municipal Study 2011SECTION 1: Intr
- Page 13 and 14: Municipal Study 2011Age and Conditi
- Page 15 and 16: Municipal Study 2011Asset Consumpti
- Page 17 and 18: Municipal Study 2011Net municipal l
- Page 19 and 20: Municipal Study 2011SECTION 7: Comp
- Page 21 and 22: Municipal Study 2011SECTION 8: Comp
- Page 23 and 24: Municipal Study 2011Introduction1
- Page 25 and 26: Municipal Study 2011Municipal Study
- Page 27 and 28: Municipal Study 2011Municipalities
- Page 29 and 30: Municipal Study 2011Socio Economic
- Page 31 and 32: Municipal Study 2011Population Stat
- Page 33 and 34: Municipal Study 2011Simcoe/Muskoka/
- Page 35 and 36: Municipal Study 2011Niagara/Hamilto
- Page 37 and 38: Municipal Study 2011Northern——%
- Page 39 and 40: Municipal Study 2011Ontario Populat
- Page 41 and 42: Municipal Study 2011Age Demographic
- Page 43 and 44: Municipal Study 2011% of Dwellings
- Page 45 and 46: Municipal Study 2011Average Househo
- Page 47 and 48: Municipal Study 2011Land Area and D
- Page 49 and 50: Municipal Study 2011Land Area and D
- Page 51 and 52: Municipal Study 2011Assessment Per
- Page 53 and 54: Municipal Study 2011Taxable Assessm
- Page 55 and 56: Municipal Study 2011Unweighted Asse
- Page 57 and 58: Unweighted Assessment Composition (
- Page 59 and 60: Municipal Study 2011Unweighted Asse
- Page 61 and 62: Municipal Study 2011Top 10 Municipa
- Page 63: Municipal Study 20112011 Shift In T
- Page 67 and 68: Municipal Study 2011Municipal Finan
- Page 69 and 70: Municipal Study 2011Evaluating a Mu
- Page 71 and 72: Financial Position Per Capita—Tre
- Page 73 and 74: Municipal Study 2011Operating Surpl
- Page 75 and 76: Municipal Study 20112010 Operating
- Page 77 and 78: Municipal Study 2011ReservesReserve
- Page 79 and 80: Municipal Study 2011Discretionary R
- Page 81 and 82: Municipal Study 2011Tax Debt Intere
- Page 83 and 84: Municipal Study 2011Debt To Reserve
- Page 85 and 86: Municipal Study 2011Debt Outstandin
- Page 87 and 88: Municipal Study 2011Net Financial L
- Page 89 and 90: Municipal Study 2011Revenue and Exp
- Page 91 and 92: Municipal Study 2011Environmental S
- Page 93 and 94: Municipal Study 2011Net Municipal L
- Page 95 and 96: Municipal Study 20112011 Net Munici
- Page 97 and 98: Municipal Study 2011Net Municipal L
- Page 99 and 100: Municipal Study 2011Net Municipal L
- Page 101 and 102: Municipal Study 20112011 Net Munici
- Page 103 and 104: Municipal Study 20112011 Net Munici
- Page 105 and 106: General Government(Sorted by Net Co
- Page 107 and 108: Municipal Study 2011FireThe goal of
- Page 109 and 110: Municipal Study 2011Fire Statistics
- Page 111 and 112: Municipal Study 2011Fire Costs (con
- Page 113 and 114: Municipal Study 2011Police(Sorted b
- Page 115 and 116:
Municipal Study 2011Court Security
- Page 117 and 118:
Municipal Study 2011Protective Insp
- Page 119 and 120:
Municipal Study 2011Roads ServicesA
- Page 121 and 122:
Municipal Study 2011Roadways—Pave
- Page 123 and 124:
Municipal Study 2011Roadways—Pave
- Page 125 and 126:
Roadways—Bridges and Culverts(Sor
- Page 127 and 128:
Roadways—Traffic Operations(Sorte
- Page 129 and 130:
Winter Control—Except Sidewalks,
- Page 131 and 132:
Winter Control—Sidewalks, Parking
- Page 133 and 134:
Municipal Study 2011Transit Service
- Page 135 and 136:
Municipal Study 2011ParkingParking
- Page 137 and 138:
Street Lighting(Sorted by Net Costs
- Page 139 and 140:
Storm Sewer - Urban(Sorted by Net C
- Page 141 and 142:
Storm Sewer - Rural(Sorted by Net C
- Page 143 and 144:
Waste Collection(Sorted by Net Cost
- Page 145 and 146:
Waste Diversion(Sorted by Net Costs
- Page 147 and 148:
Public Health Services(Sorted by Ne
- Page 149 and 150:
Municipal Study 2011Ambulance Servi
- Page 151 and 152:
Municipal Study 2011Emergency Measu
- Page 153 and 154:
Municipal Study 2011General Assista
- Page 155 and 156:
Assistance to the Aged(Sorted by Ne
- Page 157 and 158:
Municipal Study 2011Social HousingS
- Page 159 and 160:
Municipal Study 2011Social Housing(
- Page 161 and 162:
Social Housing(Sorted by Total Net
- Page 163 and 164:
Parks(Sorted by Net Costs per $100,
- Page 165 and 166:
Municipal Study 2011Sports and Recr
- Page 167 and 168:
Recreation Programming Cont’d(Sor
- Page 169 and 170:
Recreation Facilities—Other(sorte
- Page 171 and 172:
Recreation Facilities and Programmi
- Page 173 and 174:
Municipal Study 2011LibraryPARTNERI
- Page 175 and 176:
Municipal Study 2011Library (cont
- Page 177 and 178:
Municipal Study 2011Cultural Servic
- Page 179 and 180:
Municipal Study 2011PlanningMunicip
- Page 181 and 182:
Commercial and Industrial(Sorted by
- Page 183 and 184:
Municipal Study 2011User FeesAnalyz
- Page 185 and 186:
Municipal Study 2011SingleDetachedD
- Page 187 and 188:
2011 Development Charges—Grouped
- Page 189 and 190:
SingleDetachedDwellingsper unitToro
- Page 191 and 192:
2011 Building Permit Fees (sorted a
- Page 193 and 194:
2011 Building Permit Fees (sorted b
- Page 195 and 196:
Municipal Study 20112011 Transit Fa
- Page 197 and 198:
Municipal Study 2011Tax PoliciesThe
- Page 199 and 200:
Municipal Study 2011Multi-Residenti
- Page 201 and 202:
Municipal Study 2011Industrial (res
- Page 203 and 204:
Municipal Study 2011New Multi-Resid
- Page 205 and 206:
Municipal Study 2011Comparison of R
- Page 207 and 208:
Municipal Study 2011General Introdu
- Page 209 and 210:
Municipal Study 20112011 Total Prop
- Page 211 and 212:
Municipal Study 20112011 Education
- Page 213 and 214:
2011 Municipal Rates (Upper and Low
- Page 215 and 216:
Municipal Study 2011Presentation of
- Page 217 and 218:
Municipal Study 2011Residential Com
- Page 219 and 220:
Municipal Study 2011Residential Com
- Page 221 and 222:
Municipal Study 2011Residential Com
- Page 223 and 224:
Municipal Study 2011Residential Com
- Page 225 and 226:
Municipal Study 2011Residential Com
- Page 227 and 228:
Municipal Study 2011Residential Com
- Page 229 and 230:
Municipal Study 2011Residential Com
- Page 231 and 232:
Multi-Residential Walk-Ups(taxes ca
- Page 233 and 234:
Municipal Study 2011Multi-Residenti
- Page 235 and 236:
Multi-Residential Comparisons - Wal
- Page 237 and 238:
Municipal Study 2011Multi-Residenti
- Page 239 and 240:
Municipal Study 2011Multi-Residenti
- Page 241 and 242:
Municipal Study 2011Multi-Residenti
- Page 243 and 244:
Municipal Study 2011Multi-Residenti
- Page 245 and 246:
Commercial Comparisons - Office Bui
- Page 247 and 248:
Municipal Study 2011Commercial Comp
- Page 249 and 250:
Municipal Study 2011Commercial Comp
- Page 251 and 252:
Municipal Study 2011Commercial Comp
- Page 253 and 254:
Commercial Comparisons - Neighbourh
- Page 255 and 256:
Municipal Study 2011Commercial Comp
- Page 257 and 258:
Municipal Study 2011Commercial Comp
- Page 259 and 260:
Municipal Study 2011Commercial Comp
- Page 261 and 262:
Municipal Study 2011Commercial Comp
- Page 263 and 264:
Municipal Study 2011Commercial Comp
- Page 265 and 266:
Commercial Comparisons - Hotel—by
- Page 267 and 268:
Commercial Comparisons - Hotel—by
- Page 269 and 270:
Municipal Study 2011Commercial Comp
- Page 271 and 272:
Commercial Comparisons - Motel—by
- Page 273 and 274:
Municipal Study 2011Commercial Comp
- Page 275 and 276:
Commercial Comparisons - Motel—by
- Page 277 and 278:
Municipal Study 2011Commercial Summ
- Page 279 and 280:
Commercial Comparisons - Summary (c
- Page 281 and 282:
Municipal Study 2011Industrial Comp
- Page 283 and 284:
Municipal Study 2011Standard Indust
- Page 285 and 286:
Municipal Study 2011$3.00Standard I
- Page 287 and 288:
Municipal Study 2011Standard Indust
- Page 289 and 290:
Municipal Study 2011Large Industria
- Page 291 and 292:
Municipal Study 2011Large Industria
- Page 293 and 294:
Municipal Study 2011Large Industria
- Page 295 and 296:
Municipal Study 2011Large Industria
- Page 297 and 298:
Industrial Comparisons - Industrial
- Page 299 and 300:
Municipal Study 2011Industrial Comp
- Page 301 and 302:
Municipal Study 2011Industrial Comp
- Page 303 and 304:
Municipal Study 2011Industrial Comp
- Page 305 and 306:
Municipal Study 2011Industrial Summ
- Page 307 and 308:
Municipal Study 2011Industrial Summ
- Page 309 and 310:
Municipal Study 2011Water/Wastewate
- Page 311 and 312:
Municipal Study 2011Water and Waste
- Page 313 and 314:
Municipal Study 2011Comparison of R
- Page 315 and 316:
Municipal Study 2011Comparison of T
- Page 317 and 318:
Municipal Study 2011Comparison of W
- Page 319 and 320:
Municipal Study 2011Comparison of W
- Page 321 and 322:
Municipal Study 2011Comparison of W
- Page 323 and 324:
Water/Wastewater Costs as a Percent
- Page 325 and 326:
Municipal Study 2011Water and Waste
- Page 327 and 328:
Municipal Study 2011Water and Waste
- Page 329 and 330:
Municipal Study 2011Wastewater Oper
- Page 331 and 332:
Municipal Study 2011Wastewater Asse
- Page 333 and 334:
Municipal Study 2011Water Reserves
- Page 335 and 336:
Municipal Study 2011Wastewater Rese
- Page 337 and 338:
Municipal Study 2011Wastewater Debt
- Page 339 and 340:
Municipal Study 2011Water Net Finan
- Page 341 and 342:
Municipal Study 2011Wastewater Net
- Page 343 and 344:
Municipal Study 2011Water MPMPs Con
- Page 345 and 346:
Municipal Study 2011Wastewater MPMP
- Page 347 and 348:
Municipal Study 2011Taxes and Water
- Page 349 and 350:
Average Household Income and Dwelli
- Page 351 and 352:
Property Taxes as a Percentage of I
- Page 353 and 354:
Municipal Study 2011Total Municipal
- Page 355 and 356:
Municipal Study 2011Total Municipal
- Page 357 and 358:
Municipal Study 2011Economic Develo
- Page 359 and 360:
Municipal Study 2011Section 4 of th
- Page 361 and 362:
Municipal Study 2011Business Retent
- Page 363 and 364:
Municipal Study 2011Business Retent
- Page 365 and 366:
Municipal Study 2011Business Retent
- Page 367 and 368:
Municipal Study 2011Business Retent
- Page 369 and 370:
Municipal Study 2011Business Retent
- Page 371 and 372:
Municipal Study 2011Business Retent
- Page 373 and 374:
Municipal Study 2011Business Retent
- Page 375 and 376:
Municipal Study 2011Business Retent
- Page 377 and 378:
Municipal Study 2011Business Retent
- Page 379 and 380:
Municipal Study 2011Business Retent
- Page 381 and 382:
Municipal Study 2011Business Retent
- Page 383 and 384:
Municipal Study 2011Business Retent
- Page 385 and 386:
Municipal Study 2011Downtown/Area S
- Page 387 and 388:
Municipal Study 2011Downtown/Area S
- Page 389 and 390:
Municipal Study 2011Downtown/Area S
- Page 391 and 392:
Municipal Study 2011MunicipalityCor
- Page 393 and 394:
Municipal Study 2011MunicipalityKit
- Page 395 and 396:
Municipal Study 2011Downtown/Area S
- Page 397 and 398:
Municipal Study 2011Downtown/Area S
- Page 399 and 400:
Municipal Study 2011Downtown/Area S
- Page 401 and 402:
Municipal Study 2011WellandWhitbyWh
- Page 403 and 404:
Municipal Study 2011Brownfield Rede
- Page 405 and 406:
Municipal Study 2011Brownfield Rede
- Page 407 and 408:
Municipal Study 2011Brownfield Rede
- Page 409 and 410:
Industrial ParksMunicipal Study 201
- Page 411:
Industrial ParksMunicipal Study 201