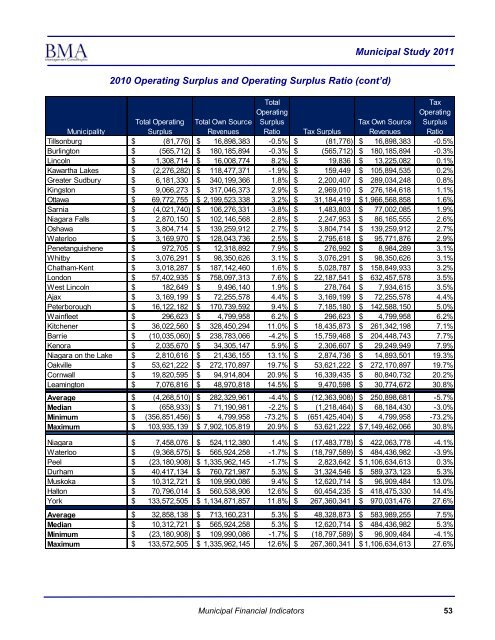
<strong>Municipal</strong> <strong>Study</strong> <strong>2011</strong>2010 Operating Surplus and Operating Surplus Ratio(Sorted by tax operating ratio—last column)<strong>Municipal</strong>ityTotal OperatingSurplusTotal Own SourceRevenuesTotalOperatingSurplusRatio Tax SurplusTax Own SourceRevenuesTaxOperatingSurplusRatioWellesley $ (3,737,380) $ 5,109,038 -73.2% $ (3,737,380) $ 5,109,038 -73.2%Quinte West $ (24,377,112) $ 56,709,693 -43.0% $ (22,304,176) $ 45,745,909 -48.8%Huntsville $ (4,405,970) $ 14,196,165 -31.0% $ (4,405,970) $ 14,196,165 -31.0%Wilmot $ (2,091,993) $ 12,979,510 -16.1% $ (2,760,733) $ 9,754,782 -28.3%Meaford $ (3,366,530) $ 14,264,048 -23.6% $ (2,840,047) $ 11,675,683 -24.3%Woolwich $ (2,778,951) $ 16,202,592 -17.2% $ (3,177,346) $ 13,321,065 -23.9%Thorold $ (1,730,151) $ 19,048,708 -9.1% $ (2,886,429) $ 13,542,597 -21.3%Brampton $ (69,398,001) $ 389,480,208 -17.8% $ (69,398,001) $ 389,480,208 -17.8%The Blue Mountains $ (3,403,074) $ 18,793,046 -18.1% $ (2,379,794) $ 13,550,653 -17.6%Caledon $ (9,192,157) $ 53,304,941 -17.2% $ (9,192,157) $ 53,304,941 -17.2%Markham $ (34,067,546) $ 260,051,959 -13.1% $ (32,139,019) $ 191,457,822 -16.8%Sault Ste. Marie $ (13,125,946) $ 154,809,949 -8.5% $ (19,283,658) $ 132,158,880 -14.6%Halton Hills $ (6,059,027) $ 42,895,591 -14.1% $ (6,059,027) $ 42,895,591 -14.1%Thunder Bay $ (48,058,352) $ 369,024,407 -13.0% $ (43,866,606) $ 335,495,293 -13.1%Tecumseh $ (3,994,625) $ 28,138,044 -14.2% $ (2,592,966) $ 19,950,739 -13.0%Mississauga $ (73,738,703) $ 568,454,214 -13.0% $ (73,738,703) $ 568,454,214 -13.0%Fort Erie $ (572,831) $ 38,314,146 -1.5% $ (3,061,519) $ 23,631,592 -13.0%Clarington $ (7,402,983) $ 58,507,985 -12.7% $ (7,402,983) $ 58,507,985 -12.7%Welland $ (4,013,283) $ 59,668,286 -6.7% $ (4,937,071) $ 39,378,235 -12.5%Milton $ (8,023,935) $ 70,126,384 -11.4% $ (8,023,935) $ 70,126,384 -11.4%Gravenhurst $ (1,098,251) $ 10,380,055 -10.6% $ (1,098,251) $ 10,380,055 -10.6%Middlesex Centre $ (2,354,648) $ 14,938,091 -15.8% $ (1,283,495) $ 12,156,497 -10.6%King $ (3,646,696) $ 26,828,761 -13.6% $ (2,451,195) $ 25,054,794 -9.8%Toronto $ (356,851,456) $ 7,902,105,819 -4.5% $ (651,425,404) $ 7,149,462,066 -9.1%Newmarket $ (3,613,187) $ 79,092,710 -4.6% $ (5,149,070) $ 58,062,451 -8.9%Whitchurch-Stouffville $ (2,564,670) $ 35,242,436 -7.3% $ (2,564,670) $ 29,267,691 -8.8%East Gwillimbury $ (2,880,486) $ 19,529,169 -14.7% $ (1,153,433) $ 16,238,295 -7.1%St. Thomas $ (1,792,247) $ 65,299,779 -2.7% $ (3,145,383) $ 51,214,456 -6.1%Seguin $ (745,035) $ 12,866,428 -5.8% $ (745,035) $ 12,866,428 -5.8%Fort Frances $ (239,616) $ 19,490,903 -1.2% $ (850,227) $ 14,953,085 -5.7%Pickering $ (3,520,773) $ 69,393,863 -5.1% $ (3,520,773) $ 69,393,863 -5.1%Georgina $ 1,604,052 $ 39,377,420 4.1% $ (1,685,145) $ 36,749,980 -4.6%St. Marys $ (440,132) $ 14,453,847 -3.0% $ (495,735) $ 12,244,854 -4.0%Hamilton $ 103,935,139 $ 1,104,440,702 9.4% $ (29,813,114) $ 956,235,028 -3.1%Cambridge $ (5,256,198) $ 137,551,537 -3.8% $ (2,797,687) $ 96,102,591 -2.9%St Catharines $ 3,748,879 $ 124,782,092 3.0% $ (1,916,282) $ 108,458,616 -1.8%Stratford $ 2,833,228 $ 76,062,200 3.7% $ (1,120,744) $ 66,974,996 -1.7%Windsor $ 13,634,656 $ 503,179,678 2.7% $ (5,681,418) $ 446,789,376 -1.3%<strong>Brantford</strong> $ 7,406,219 $ 212,984,839 3.5% $ (2,229,586) $ 177,938,454 -1.3%Guelph $ 371,464 $ 267,887,795 0.1% $ (2,829,518) $ 228,691,535 -1.2%Timmins $ 2,518,570 $ 87,833,484 2.9% $ (516,521) $ 73,757,698 -0.7%North Bay $ (2,590,633) $ 108,339,027 -2.4% $ (610,560) $ 90,247,275 -0.7%<strong>Municipal</strong><strong>Municipal</strong>FinancialFinancialInformationIndicators52
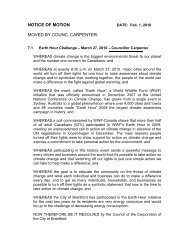
<strong>Municipal</strong> <strong>Study</strong> <strong>2011</strong>2010 Operating Surplus and Operating Surplus Ratio (cont’d)<strong>Municipal</strong>ityTotal OperatingSurplusTotal Own SourceRevenuesTotalOperatingSurplusRatio Tax SurplusTax Own SourceRevenuesTaxOperatingSurplusRatioTillsonburg $ (81,776) $ 16,898,383 -0.5% $ (81,776) $ 16,898,383 -0.5%Burlington $ (565,712) $ 180,185,894 -0.3% $ (565,712) $ 180,185,894 -0.3%Lincoln $ 1,308,714 $ 16,008,774 8.2% $ 19,836 $ 13,225,082 0.1%Kawartha Lakes $ (2,276,282) $ 118,477,371 -1.9% $ 159,449 $ 105,894,535 0.2%Greater Sudbury $ 6,181,330 $ 340,199,366 1.8% $ 2,200,407 $ 289,034,248 0.8%Kingston $ 9,066,273 $ 317,046,373 2.9% $ 2,969,010 $ 276,184,618 1.1%Ottawa $ 69,772,755 $ 2,199,523,338 3.2% $ 31,184,419 $ 1,966,568,858 1.6%Sarnia $ (4,021,740) $ 106,276,331 -3.8% $ 1,483,803 $ 77,002,085 1.9%Niagara Falls $ 2,870,150 $ 102,146,568 2.8% $ 2,247,953 $ 86,165,555 2.6%Oshawa $ 3,804,714 $ 139,259,912 2.7% $ 3,804,714 $ 139,259,912 2.7%Waterloo $ 3,169,970 $ 128,043,736 2.5% $ 2,795,618 $ 95,771,876 2.9%Penetanguishene $ 972,705 $ 12,318,892 7.9% $ 276,992 $ 8,984,289 3.1%Whitby $ 3,076,291 $ 98,350,626 3.1% $ 3,076,291 $ 98,350,626 3.1%Chatham-Kent $ 3,018,287 $ 187,142,460 1.6% $ 5,028,787 $ 158,849,933 3.2%London $ 57,402,935 $ 758,097,313 7.6% $ 22,187,541 $ 632,457,578 3.5%West Lincoln $ 182,649 $ 9,496,140 1.9% $ 278,764 $ 7,934,615 3.5%Ajax $ 3,169,199 $ 72,255,578 4.4% $ 3,169,199 $ 72,255,578 4.4%Peterborough $ 16,122,182 $ 170,739,592 9.4% $ 7,185,180 $ 142,588,150 5.0%Wainfleet $ 296,623 $ 4,799,958 6.2% $ 296,623 $ 4,799,958 6.2%Kitchener $ 36,022,560 $ 328,450,294 11.0% $ 18,435,873 $ 261,342,198 7.1%Barrie $ (10,035,060) $ 238,783,066 -4.2% $ 15,759,468 $ 204,448,743 7.7%Kenora $ 2,035,670 $ 34,305,147 5.9% $ 2,306,607 $ 29,249,949 7.9%Niagara on the Lake $ 2,810,616 $ 21,436,155 13.1% $ 2,874,736 $ 14,893,501 19.3%Oakville $ 53,621,222 $ 272,170,897 19.7% $ 53,621,222 $ 272,170,897 19.7%Cornwall $ 19,820,595 $ 94,914,804 20.9% $ 16,339,435 $ 80,840,732 20.2%Leamington $ 7,076,816 $ 48,970,818 14.5% $ 9,470,598 $ 30,774,672 30.8%Average $ (4,268,510) $ 282,329,961 -4.4% $ (12,363,908) $ 250,898,681 -5.7%Median $ (658,933) $ 71,190,981 -2.2% $ (1,218,464) $ 68,184,430 -3.0%Minimum $ (356,851,456) $ 4,799,958 -73.2% $ (651,425,404) $ 4,799,958 -73.2%Maximum $ 103,935,139 $ 7,902,105,819 20.9% $ 53,621,222 $ 7,149,462,066 30.8%Niagara $ 7,458,076 $ 524,112,380 1.4% $ (17,483,778) $ 422,063,778 -4.1%Waterloo $ (9,368,575) $ 565,924,258 -1.7% $ (18,797,589) $ 484,436,982 -3.9%Peel $ (23,180,908) $ 1,335,962,145 -1.7% $ 2,823,642 $ 1,106,634,613 0.3%Durham $ 40,417,134 $ 760,721,987 5.3% $ 31,324,546 $ 589,373,123 5.3%Muskoka $ 10,312,721 $ 109,990,086 9.4% $ 12,620,714 $ 96,909,484 13.0%Halton $ 70,796,014 $ 560,538,906 12.6% $ 60,454,235 $ 418,475,330 14.4%York $ 133,572,505 $ 1,134,871,857 11.8% $ 267,360,341 $ 970,031,476 27.6%Average $ 32,858,138 $ 713,160,231 5.3% $ 48,328,873 $ 583,989,255 7.5%Median $ 10,312,721 $ 565,924,258 5.3% $ 12,620,714 $ 484,436,982 5.3%Minimum $ (23,180,908) $ 109,990,086 -1.7% $ (18,797,589) $ 96,909,484 -4.1%Maximum $ 133,572,505 $ 1,335,962,145 12.6% $ 267,360,341 $ 1,106,634,613 27.6%<strong>Municipal</strong><strong>Municipal</strong>FinancialFinancialInformationIndicators53
- Page 5 and 6:
Municipal Study 2011Executive Summa
- Page 7 and 8:
Municipal Study 2011BrantfordSurvey
- Page 9 and 10:
Municipal Study 20112011 Comparison
- Page 11 and 12:
Municipal Study 2011SECTION 1: Intr
- Page 13 and 14:
Municipal Study 2011Age and Conditi
- Page 15 and 16:
Municipal Study 2011Asset Consumpti
- Page 17 and 18:
Municipal Study 2011Net municipal l
- Page 19 and 20:
Municipal Study 2011SECTION 7: Comp
- Page 21 and 22:
Municipal Study 2011SECTION 8: Comp
- Page 23 and 24: Municipal Study 2011Introduction1
- Page 25 and 26: Municipal Study 2011Municipal Study
- Page 27 and 28: Municipal Study 2011Municipalities
- Page 29 and 30: Municipal Study 2011Socio Economic
- Page 31 and 32: Municipal Study 2011Population Stat
- Page 33 and 34: Municipal Study 2011Simcoe/Muskoka/
- Page 35 and 36: Municipal Study 2011Niagara/Hamilto
- Page 37 and 38: Municipal Study 2011Northern——%
- Page 39 and 40: Municipal Study 2011Ontario Populat
- Page 41 and 42: Municipal Study 2011Age Demographic
- Page 43 and 44: Municipal Study 2011% of Dwellings
- Page 45 and 46: Municipal Study 2011Average Househo
- Page 47 and 48: Municipal Study 2011Land Area and D
- Page 49 and 50: Municipal Study 2011Land Area and D
- Page 51 and 52: Municipal Study 2011Assessment Per
- Page 53 and 54: Municipal Study 2011Taxable Assessm
- Page 55 and 56: Municipal Study 2011Unweighted Asse
- Page 57 and 58: Unweighted Assessment Composition (
- Page 59 and 60: Municipal Study 2011Unweighted Asse
- Page 61 and 62: Municipal Study 2011Top 10 Municipa
- Page 63 and 64: Municipal Study 20112011 Shift In T
- Page 65 and 66: Municipal Study 2011Building Permit
- Page 67 and 68: Municipal Study 2011Municipal Finan
- Page 69 and 70: Municipal Study 2011Evaluating a Mu
- Page 71 and 72: Financial Position Per Capita—Tre
- Page 73: Municipal Study 2011Operating Surpl
- Page 77 and 78: Municipal Study 2011ReservesReserve
- Page 79 and 80: Municipal Study 2011Discretionary R
- Page 81 and 82: Municipal Study 2011Tax Debt Intere
- Page 83 and 84: Municipal Study 2011Debt To Reserve
- Page 85 and 86: Municipal Study 2011Debt Outstandin
- Page 87 and 88: Municipal Study 2011Net Financial L
- Page 89 and 90: Municipal Study 2011Revenue and Exp
- Page 91 and 92: Municipal Study 2011Environmental S
- Page 93 and 94: Municipal Study 2011Net Municipal L
- Page 95 and 96: Municipal Study 20112011 Net Munici
- Page 97 and 98: Municipal Study 2011Net Municipal L
- Page 99 and 100: Municipal Study 2011Net Municipal L
- Page 101 and 102: Municipal Study 20112011 Net Munici
- Page 103 and 104: Municipal Study 20112011 Net Munici
- Page 105 and 106: General Government(Sorted by Net Co
- Page 107 and 108: Municipal Study 2011FireThe goal of
- Page 109 and 110: Municipal Study 2011Fire Statistics
- Page 111 and 112: Municipal Study 2011Fire Costs (con
- Page 113 and 114: Municipal Study 2011Police(Sorted b
- Page 115 and 116: Municipal Study 2011Court Security
- Page 117 and 118: Municipal Study 2011Protective Insp
- Page 119 and 120: Municipal Study 2011Roads ServicesA
- Page 121 and 122: Municipal Study 2011Roadways—Pave
- Page 123 and 124: Municipal Study 2011Roadways—Pave
- Page 125 and 126:
Roadways—Bridges and Culverts(Sor
- Page 127 and 128:
Roadways—Traffic Operations(Sorte
- Page 129 and 130:
Winter Control—Except Sidewalks,
- Page 131 and 132:
Winter Control—Sidewalks, Parking
- Page 133 and 134:
Municipal Study 2011Transit Service
- Page 135 and 136:
Municipal Study 2011ParkingParking
- Page 137 and 138:
Street Lighting(Sorted by Net Costs
- Page 139 and 140:
Storm Sewer - Urban(Sorted by Net C
- Page 141 and 142:
Storm Sewer - Rural(Sorted by Net C
- Page 143 and 144:
Waste Collection(Sorted by Net Cost
- Page 145 and 146:
Waste Diversion(Sorted by Net Costs
- Page 147 and 148:
Public Health Services(Sorted by Ne
- Page 149 and 150:
Municipal Study 2011Ambulance Servi
- Page 151 and 152:
Municipal Study 2011Emergency Measu
- Page 153 and 154:
Municipal Study 2011General Assista
- Page 155 and 156:
Assistance to the Aged(Sorted by Ne
- Page 157 and 158:
Municipal Study 2011Social HousingS
- Page 159 and 160:
Municipal Study 2011Social Housing(
- Page 161 and 162:
Social Housing(Sorted by Total Net
- Page 163 and 164:
Parks(Sorted by Net Costs per $100,
- Page 165 and 166:
Municipal Study 2011Sports and Recr
- Page 167 and 168:
Recreation Programming Cont’d(Sor
- Page 169 and 170:
Recreation Facilities—Other(sorte
- Page 171 and 172:
Recreation Facilities and Programmi
- Page 173 and 174:
Municipal Study 2011LibraryPARTNERI
- Page 175 and 176:
Municipal Study 2011Library (cont
- Page 177 and 178:
Municipal Study 2011Cultural Servic
- Page 179 and 180:
Municipal Study 2011PlanningMunicip
- Page 181 and 182:
Commercial and Industrial(Sorted by
- Page 183 and 184:
Municipal Study 2011User FeesAnalyz
- Page 185 and 186:
Municipal Study 2011SingleDetachedD
- Page 187 and 188:
2011 Development Charges—Grouped
- Page 189 and 190:
SingleDetachedDwellingsper unitToro
- Page 191 and 192:
2011 Building Permit Fees (sorted a
- Page 193 and 194:
2011 Building Permit Fees (sorted b
- Page 195 and 196:
Municipal Study 20112011 Transit Fa
- Page 197 and 198:
Municipal Study 2011Tax PoliciesThe
- Page 199 and 200:
Municipal Study 2011Multi-Residenti
- Page 201 and 202:
Municipal Study 2011Industrial (res
- Page 203 and 204:
Municipal Study 2011New Multi-Resid
- Page 205 and 206:
Municipal Study 2011Comparison of R
- Page 207 and 208:
Municipal Study 2011General Introdu
- Page 209 and 210:
Municipal Study 20112011 Total Prop
- Page 211 and 212:
Municipal Study 20112011 Education
- Page 213 and 214:
2011 Municipal Rates (Upper and Low
- Page 215 and 216:
Municipal Study 2011Presentation of
- Page 217 and 218:
Municipal Study 2011Residential Com
- Page 219 and 220:
Municipal Study 2011Residential Com
- Page 221 and 222:
Municipal Study 2011Residential Com
- Page 223 and 224:
Municipal Study 2011Residential Com
- Page 225 and 226:
Municipal Study 2011Residential Com
- Page 227 and 228:
Municipal Study 2011Residential Com
- Page 229 and 230:
Municipal Study 2011Residential Com
- Page 231 and 232:
Multi-Residential Walk-Ups(taxes ca
- Page 233 and 234:
Municipal Study 2011Multi-Residenti
- Page 235 and 236:
Multi-Residential Comparisons - Wal
- Page 237 and 238:
Municipal Study 2011Multi-Residenti
- Page 239 and 240:
Municipal Study 2011Multi-Residenti
- Page 241 and 242:
Municipal Study 2011Multi-Residenti
- Page 243 and 244:
Municipal Study 2011Multi-Residenti
- Page 245 and 246:
Commercial Comparisons - Office Bui
- Page 247 and 248:
Municipal Study 2011Commercial Comp
- Page 249 and 250:
Municipal Study 2011Commercial Comp
- Page 251 and 252:
Municipal Study 2011Commercial Comp
- Page 253 and 254:
Commercial Comparisons - Neighbourh
- Page 255 and 256:
Municipal Study 2011Commercial Comp
- Page 257 and 258:
Municipal Study 2011Commercial Comp
- Page 259 and 260:
Municipal Study 2011Commercial Comp
- Page 261 and 262:
Municipal Study 2011Commercial Comp
- Page 263 and 264:
Municipal Study 2011Commercial Comp
- Page 265 and 266:
Commercial Comparisons - Hotel—by
- Page 267 and 268:
Commercial Comparisons - Hotel—by
- Page 269 and 270:
Municipal Study 2011Commercial Comp
- Page 271 and 272:
Commercial Comparisons - Motel—by
- Page 273 and 274:
Municipal Study 2011Commercial Comp
- Page 275 and 276:
Commercial Comparisons - Motel—by
- Page 277 and 278:
Municipal Study 2011Commercial Summ
- Page 279 and 280:
Commercial Comparisons - Summary (c
- Page 281 and 282:
Municipal Study 2011Industrial Comp
- Page 283 and 284:
Municipal Study 2011Standard Indust
- Page 285 and 286:
Municipal Study 2011$3.00Standard I
- Page 287 and 288:
Municipal Study 2011Standard Indust
- Page 289 and 290:
Municipal Study 2011Large Industria
- Page 291 and 292:
Municipal Study 2011Large Industria
- Page 293 and 294:
Municipal Study 2011Large Industria
- Page 295 and 296:
Municipal Study 2011Large Industria
- Page 297 and 298:
Industrial Comparisons - Industrial
- Page 299 and 300:
Municipal Study 2011Industrial Comp
- Page 301 and 302:
Municipal Study 2011Industrial Comp
- Page 303 and 304:
Municipal Study 2011Industrial Comp
- Page 305 and 306:
Municipal Study 2011Industrial Summ
- Page 307 and 308:
Municipal Study 2011Industrial Summ
- Page 309 and 310:
Municipal Study 2011Water/Wastewate
- Page 311 and 312:
Municipal Study 2011Water and Waste
- Page 313 and 314:
Municipal Study 2011Comparison of R
- Page 315 and 316:
Municipal Study 2011Comparison of T
- Page 317 and 318:
Municipal Study 2011Comparison of W
- Page 319 and 320:
Municipal Study 2011Comparison of W
- Page 321 and 322:
Municipal Study 2011Comparison of W
- Page 323 and 324:
Water/Wastewater Costs as a Percent
- Page 325 and 326:
Municipal Study 2011Water and Waste
- Page 327 and 328:
Municipal Study 2011Water and Waste
- Page 329 and 330:
Municipal Study 2011Wastewater Oper
- Page 331 and 332:
Municipal Study 2011Wastewater Asse
- Page 333 and 334:
Municipal Study 2011Water Reserves
- Page 335 and 336:
Municipal Study 2011Wastewater Rese
- Page 337 and 338:
Municipal Study 2011Wastewater Debt
- Page 339 and 340:
Municipal Study 2011Water Net Finan
- Page 341 and 342:
Municipal Study 2011Wastewater Net
- Page 343 and 344:
Municipal Study 2011Water MPMPs Con
- Page 345 and 346:
Municipal Study 2011Wastewater MPMP
- Page 347 and 348:
Municipal Study 2011Taxes and Water
- Page 349 and 350:
Average Household Income and Dwelli
- Page 351 and 352:
Property Taxes as a Percentage of I
- Page 353 and 354:
Municipal Study 2011Total Municipal
- Page 355 and 356:
Municipal Study 2011Total Municipal
- Page 357 and 358:
Municipal Study 2011Economic Develo
- Page 359 and 360:
Municipal Study 2011Section 4 of th
- Page 361 and 362:
Municipal Study 2011Business Retent
- Page 363 and 364:
Municipal Study 2011Business Retent
- Page 365 and 366:
Municipal Study 2011Business Retent
- Page 367 and 368:
Municipal Study 2011Business Retent
- Page 369 and 370:
Municipal Study 2011Business Retent
- Page 371 and 372:
Municipal Study 2011Business Retent
- Page 373 and 374:
Municipal Study 2011Business Retent
- Page 375 and 376:
Municipal Study 2011Business Retent
- Page 377 and 378:
Municipal Study 2011Business Retent
- Page 379 and 380:
Municipal Study 2011Business Retent
- Page 381 and 382:
Municipal Study 2011Business Retent
- Page 383 and 384:
Municipal Study 2011Business Retent
- Page 385 and 386:
Municipal Study 2011Downtown/Area S
- Page 387 and 388:
Municipal Study 2011Downtown/Area S
- Page 389 and 390:
Municipal Study 2011Downtown/Area S
- Page 391 and 392:
Municipal Study 2011MunicipalityCor
- Page 393 and 394:
Municipal Study 2011MunicipalityKit
- Page 395 and 396:
Municipal Study 2011Downtown/Area S
- Page 397 and 398:
Municipal Study 2011Downtown/Area S
- Page 399 and 400:
Municipal Study 2011Downtown/Area S
- Page 401 and 402:
Municipal Study 2011WellandWhitbyWh
- Page 403 and 404:
Municipal Study 2011Brownfield Rede
- Page 405 and 406:
Municipal Study 2011Brownfield Rede
- Page 407 and 408:
Municipal Study 2011Brownfield Rede
- Page 409 and 410:
Industrial ParksMunicipal Study 201
- Page 411:
Industrial ParksMunicipal Study 201