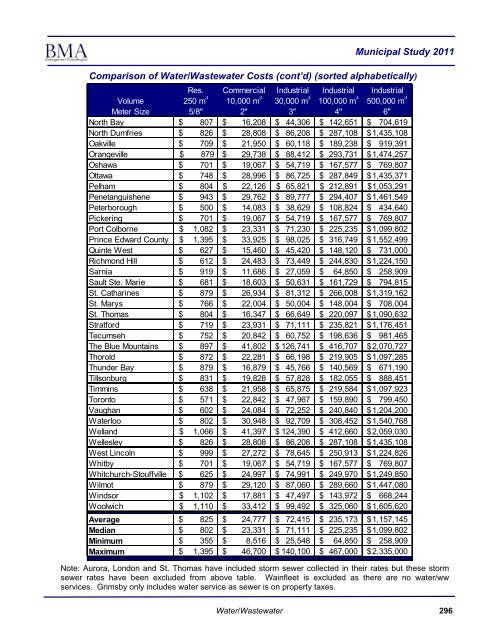
<strong>Municipal</strong> <strong>Study</strong> <strong>2011</strong>Comparison <strong>of</strong> Water/Wastewater Costs (cont’d) (sorted alphabetically)Res. Commercial Industrial Industrial IndustrialVolume 250 m 3 10,000 m 3 30,000 m 3 100,000 m 3 500,000 m 3Meter Size 5/8" 2" 3" 4" 6"North Bay $ 807 $ 16,208 $ 44,306 $ 142,651 $ 704,619North Dumfries $ 826 $ 28,808 $ 86,208 $ 287,108 $ 1,435,108Oakville $ 709 $ 21,950 $ 60,118 $ 189,238 $ 919,391Orangeville $ 879 $ 29,738 $ 88,412 $ 293,731 $ 1,474,257Oshawa $ 701 $ 19,067 $ 54,719 $ 167,577 $ 769,807Ottawa $ 748 $ 28,996 $ 86,725 $ 287,849 $ 1,435,371Pelham $ 804 $ 22,126 $ 65,821 $ 212,891 $ 1,053,291Penetanguishene $ 943 $ 29,762 $ 89,777 $ 294,407 $ 1,461,549Peterborough $ 500 $ 14,083 $ 38,629 $ 108,824 $ 434,640Pickering $ 701 $ 19,067 $ 54,719 $ 167,577 $ 769,807Port Colborne $ 1,082 $ 23,331 $ 71,230 $ 225,235 $ 1,099,802Prince Edward County $ 1,395 $ 33,925 $ 98,025 $ 316,749 $ 1,552,499Quinte West $ 627 $ 15,460 $ 45,420 $ 148,120 $ 731,000Richmond Hill $ 612 $ 24,483 $ 73,449 $ 244,830 $ 1,224,150Sarnia $ 919 $ 11,686 $ 27,059 $ 64,850 $ 258,909Sault Ste. Marie $ 681 $ 18,603 $ 50,631 $ 161,729 $ 794,815St. Catharines $ 879 $ 26,934 $ 81,312 $ 266,008 $ 1,319,162St. Marys $ 766 $ 22,004 $ 50,004 $ 148,004 $ 708,004St. Thomas $ 804 $ 16,347 $ 66,649 $ 220,097 $ 1,090,632Stratford $ 719 $ 23,931 $ 71,111 $ 235,821 $ 1,176,451Tecumseh $ 752 $ 20,842 $ 60,752 $ 198,636 $ 981,465The Blue Mountains $ 897 $ 41,802 $ 126,741 $ 416,707 $ 2,070,727Thorold $ 872 $ 22,281 $ 66,198 $ 219,905 $ 1,097,285Thunder Bay $ 879 $ 16,879 $ 45,766 $ 140,569 $ 671,190Tillsonburg $ 831 $ 19,828 $ 57,828 $ 182,055 $ 888,451Timmins $ 638 $ 21,958 $ 65,875 $ 219,584 $ 1,097,923Toronto $ 571 $ 22,842 $ 47,967 $ 159,890 $ 799,450Vaughan $ 602 $ 24,084 $ 72,252 $ 240,840 $ 1,204,200Waterloo $ 802 $ 30,948 $ 92,709 $ 308,452 $ 1,540,768Welland $ 1,066 $ 41,397 $ 124,390 $ 412,660 $ 2,059,030Wellesley $ 826 $ 28,808 $ 86,208 $ 287,108 $ 1,435,108West Lincoln $ 999 $ 27,272 $ 78,645 $ 250,913 $ 1,224,826Whitby $ 701 $ 19,067 $ 54,719 $ 167,577 $ 769,807Whitchurch-Stouffville $ 625 $ 24,997 $ 74,991 $ 249,970 $ 1,249,850Wilmot $ 879 $ 29,120 $ 87,060 $ 289,660 $ 1,447,080Windsor $ 1,102 $ 17,881 $ 47,497 $ 143,972 $ 668,244Woolwich $ 1,110 $ 33,412 $ 99,492 $ 325,060 $ 1,605,620Average $ 825 $ 24,777 $ 72,415 $ 235,173 $ 1,157,145Median $ 802 $ 23,331 $ 71,111 $ 225,235 $ 1,099,802Minimum $ 355 $ 8,516 $ 25,548 $ 64,850 $ 258,909Maximum $ 1,395 $ 46,700 $ 140,100 $ 467,000 $ 2,335,000Note: Aurora, London and St. Thomas have included storm sewer collected in their rates but these stormsewer rates have been excluded from above table. Wainfleet is excluded as there are no water/wwservices. Grimsby only includes water service as sewer is on property taxes.Water/Wastewater296
<strong>Municipal</strong> <strong>Study</strong> <strong>2011</strong>Comparison <strong>of</strong> Water/Wastewater Costs—Residential (sorted lowest to highest)Residential ResidentialResidential ResidentialVolume 250 m 3 250 m 3Volume 250 m 3 250 m 3Meter Size 5/8" RankingMeter Size 5/8" RankingBrampton $ 355 lowKitchener $ 825 midCaledon $ 355 lowNorth Dumfries $ 826 midMississauga $ 355 lowWellesley $ 826 midGrimsby $ 498 lowTillsonburg $ 831 midPeterborough $ 500 lowCambridge $ 845 midKingsville $ 527 lowThorold $ 872 midToronto $ 571 lowOrangeville $ 879 midBrockville $ 589 lowSt. Catharines $ 879 midCornwall $ 592 lowWilmot $ 879 midVaughan $ 602 lowThunder Bay $ 879 midMarkham $ 604 low<strong>Brantford</strong> $ 892 midRichmond Hill $ 612 lowKingston $ 894 highHamilton $ 622 lowThe Blue Mountains $ 897 highWhitchurch-Stouffville $ 625 lowKenora $ 919 highQuinte West $ 627 lowSarnia $ 919 highTimmins $ 638 lowPenetanguishene $ 943 highAurora $ 640 lowBelleville $ 964 highGeorgina $ 674 lowInnisfil $ 972 highSault Ste. Marie $ 681 lowGreater Sudbury $ 972 highAjax $ 701 lowNiagara Falls $ 985 highClarington $ 701 lowLincoln $ 988 highOshawa $ 701 lowNiagara-on-the-Lake $ 999 highPickering $ 701 lowWest Lincoln $ 999 highWhitby $ 701 lowWelland $ 1,066 highBurlington $ 709 lowPort Colborne $ 1,082 highHalton Hills $ 709 lowWindsor $ 1,102 highMilton $ 709 lowWoolwich $ 1,110 highOakville $ 709 lowCentral Elgin $ 1,168 highStratford $ 719 midKawartha Lakes $ 1,180 highLeamington $ 741 midBracebridge $ 1,196 highOttawa $ 748 midGravenhurst $ 1,196 highTecumseh $ 752 midHuntsville $ 1,196 highBarrie $ 761 midMiddlesex Centre $ 1,205 highSt. Marys $ 766 midMeaford $ 1,213 highLondon $ 771 midLambton Shores $ 1,226 highKing $ 772 midFort Erie $ 1,257 highEast Gwillimbury $ 775 midPrince Edward County $ 1,395 highChatham-Kent $ 780 midGuelph $ 794Average $ 825midNewmarket $ 801Median $ 802midFort Frances $ 801Minimum $ 355midWaterloo $ 802Maximum $ 1,395midSt. Thomas $ 804 midPelham $ 804 midNorth Bay $ 807 midWater/Wastewater297
- Page 5 and 6:
Municipal Study 2011Executive Summa
- Page 7 and 8:
Municipal Study 2011BrantfordSurvey
- Page 9 and 10:
Municipal Study 20112011 Comparison
- Page 11 and 12:
Municipal Study 2011SECTION 1: Intr
- Page 13 and 14:
Municipal Study 2011Age and Conditi
- Page 15 and 16:
Municipal Study 2011Asset Consumpti
- Page 17 and 18:
Municipal Study 2011Net municipal l
- Page 19 and 20:
Municipal Study 2011SECTION 7: Comp
- Page 21 and 22:
Municipal Study 2011SECTION 8: Comp
- Page 23 and 24:
Municipal Study 2011Introduction1
- Page 25 and 26:
Municipal Study 2011Municipal Study
- Page 27 and 28:
Municipal Study 2011Municipalities
- Page 29 and 30:
Municipal Study 2011Socio Economic
- Page 31 and 32:
Municipal Study 2011Population Stat
- Page 33 and 34:
Municipal Study 2011Simcoe/Muskoka/
- Page 35 and 36:
Municipal Study 2011Niagara/Hamilto
- Page 37 and 38:
Municipal Study 2011Northern——%
- Page 39 and 40:
Municipal Study 2011Ontario Populat
- Page 41 and 42:
Municipal Study 2011Age Demographic
- Page 43 and 44:
Municipal Study 2011% of Dwellings
- Page 45 and 46:
Municipal Study 2011Average Househo
- Page 47 and 48:
Municipal Study 2011Land Area and D
- Page 49 and 50:
Municipal Study 2011Land Area and D
- Page 51 and 52:
Municipal Study 2011Assessment Per
- Page 53 and 54:
Municipal Study 2011Taxable Assessm
- Page 55 and 56:
Municipal Study 2011Unweighted Asse
- Page 57 and 58:
Unweighted Assessment Composition (
- Page 59 and 60:
Municipal Study 2011Unweighted Asse
- Page 61 and 62:
Municipal Study 2011Top 10 Municipa
- Page 63 and 64:
Municipal Study 20112011 Shift In T
- Page 65 and 66:
Municipal Study 2011Building Permit
- Page 67 and 68:
Municipal Study 2011Municipal Finan
- Page 69 and 70:
Municipal Study 2011Evaluating a Mu
- Page 71 and 72:
Financial Position Per Capita—Tre
- Page 73 and 74:
Municipal Study 2011Operating Surpl
- Page 75 and 76:
Municipal Study 20112010 Operating
- Page 77 and 78:
Municipal Study 2011ReservesReserve
- Page 79 and 80:
Municipal Study 2011Discretionary R
- Page 81 and 82:
Municipal Study 2011Tax Debt Intere
- Page 83 and 84:
Municipal Study 2011Debt To Reserve
- Page 85 and 86:
Municipal Study 2011Debt Outstandin
- Page 87 and 88:
Municipal Study 2011Net Financial L
- Page 89 and 90:
Municipal Study 2011Revenue and Exp
- Page 91 and 92:
Municipal Study 2011Environmental S
- Page 93 and 94:
Municipal Study 2011Net Municipal L
- Page 95 and 96:
Municipal Study 20112011 Net Munici
- Page 97 and 98:
Municipal Study 2011Net Municipal L
- Page 99 and 100:
Municipal Study 2011Net Municipal L
- Page 101 and 102:
Municipal Study 20112011 Net Munici
- Page 103 and 104:
Municipal Study 20112011 Net Munici
- Page 105 and 106:
General Government(Sorted by Net Co
- Page 107 and 108:
Municipal Study 2011FireThe goal of
- Page 109 and 110:
Municipal Study 2011Fire Statistics
- Page 111 and 112:
Municipal Study 2011Fire Costs (con
- Page 113 and 114:
Municipal Study 2011Police(Sorted b
- Page 115 and 116:
Municipal Study 2011Court Security
- Page 117 and 118:
Municipal Study 2011Protective Insp
- Page 119 and 120:
Municipal Study 2011Roads ServicesA
- Page 121 and 122:
Municipal Study 2011Roadways—Pave
- Page 123 and 124:
Municipal Study 2011Roadways—Pave
- Page 125 and 126:
Roadways—Bridges and Culverts(Sor
- Page 127 and 128:
Roadways—Traffic Operations(Sorte
- Page 129 and 130:
Winter Control—Except Sidewalks,
- Page 131 and 132:
Winter Control—Sidewalks, Parking
- Page 133 and 134:
Municipal Study 2011Transit Service
- Page 135 and 136:
Municipal Study 2011ParkingParking
- Page 137 and 138:
Street Lighting(Sorted by Net Costs
- Page 139 and 140:
Storm Sewer - Urban(Sorted by Net C
- Page 141 and 142:
Storm Sewer - Rural(Sorted by Net C
- Page 143 and 144:
Waste Collection(Sorted by Net Cost
- Page 145 and 146:
Waste Diversion(Sorted by Net Costs
- Page 147 and 148:
Public Health Services(Sorted by Ne
- Page 149 and 150:
Municipal Study 2011Ambulance Servi
- Page 151 and 152:
Municipal Study 2011Emergency Measu
- Page 153 and 154:
Municipal Study 2011General Assista
- Page 155 and 156:
Assistance to the Aged(Sorted by Ne
- Page 157 and 158:
Municipal Study 2011Social HousingS
- Page 159 and 160:
Municipal Study 2011Social Housing(
- Page 161 and 162:
Social Housing(Sorted by Total Net
- Page 163 and 164:
Parks(Sorted by Net Costs per $100,
- Page 165 and 166:
Municipal Study 2011Sports and Recr
- Page 167 and 168:
Recreation Programming Cont’d(Sor
- Page 169 and 170:
Recreation Facilities—Other(sorte
- Page 171 and 172:
Recreation Facilities and Programmi
- Page 173 and 174:
Municipal Study 2011LibraryPARTNERI
- Page 175 and 176:
Municipal Study 2011Library (cont
- Page 177 and 178:
Municipal Study 2011Cultural Servic
- Page 179 and 180:
Municipal Study 2011PlanningMunicip
- Page 181 and 182:
Commercial and Industrial(Sorted by
- Page 183 and 184:
Municipal Study 2011User FeesAnalyz
- Page 185 and 186:
Municipal Study 2011SingleDetachedD
- Page 187 and 188:
2011 Development Charges—Grouped
- Page 189 and 190:
SingleDetachedDwellingsper unitToro
- Page 191 and 192:
2011 Building Permit Fees (sorted a
- Page 193 and 194:
2011 Building Permit Fees (sorted b
- Page 195 and 196:
Municipal Study 20112011 Transit Fa
- Page 197 and 198:
Municipal Study 2011Tax PoliciesThe
- Page 199 and 200:
Municipal Study 2011Multi-Residenti
- Page 201 and 202:
Municipal Study 2011Industrial (res
- Page 203 and 204:
Municipal Study 2011New Multi-Resid
- Page 205 and 206:
Municipal Study 2011Comparison of R
- Page 207 and 208:
Municipal Study 2011General Introdu
- Page 209 and 210:
Municipal Study 20112011 Total Prop
- Page 211 and 212:
Municipal Study 20112011 Education
- Page 213 and 214:
2011 Municipal Rates (Upper and Low
- Page 215 and 216:
Municipal Study 2011Presentation of
- Page 217 and 218:
Municipal Study 2011Residential Com
- Page 219 and 220:
Municipal Study 2011Residential Com
- Page 221 and 222:
Municipal Study 2011Residential Com
- Page 223 and 224:
Municipal Study 2011Residential Com
- Page 225 and 226:
Municipal Study 2011Residential Com
- Page 227 and 228:
Municipal Study 2011Residential Com
- Page 229 and 230:
Municipal Study 2011Residential Com
- Page 231 and 232:
Multi-Residential Walk-Ups(taxes ca
- Page 233 and 234:
Municipal Study 2011Multi-Residenti
- Page 235 and 236:
Multi-Residential Comparisons - Wal
- Page 237 and 238:
Municipal Study 2011Multi-Residenti
- Page 239 and 240:
Municipal Study 2011Multi-Residenti
- Page 241 and 242:
Municipal Study 2011Multi-Residenti
- Page 243 and 244:
Municipal Study 2011Multi-Residenti
- Page 245 and 246:
Commercial Comparisons - Office Bui
- Page 247 and 248:
Municipal Study 2011Commercial Comp
- Page 249 and 250:
Municipal Study 2011Commercial Comp
- Page 251 and 252:
Municipal Study 2011Commercial Comp
- Page 253 and 254:
Commercial Comparisons - Neighbourh
- Page 255 and 256:
Municipal Study 2011Commercial Comp
- Page 257 and 258:
Municipal Study 2011Commercial Comp
- Page 259 and 260:
Municipal Study 2011Commercial Comp
- Page 261 and 262:
Municipal Study 2011Commercial Comp
- Page 263 and 264:
Municipal Study 2011Commercial Comp
- Page 265 and 266:
Commercial Comparisons - Hotel—by
- Page 267 and 268: Commercial Comparisons - Hotel—by
- Page 269 and 270: Municipal Study 2011Commercial Comp
- Page 271 and 272: Commercial Comparisons - Motel—by
- Page 273 and 274: Municipal Study 2011Commercial Comp
- Page 275 and 276: Commercial Comparisons - Motel—by
- Page 277 and 278: Municipal Study 2011Commercial Summ
- Page 279 and 280: Commercial Comparisons - Summary (c
- Page 281 and 282: Municipal Study 2011Industrial Comp
- Page 283 and 284: Municipal Study 2011Standard Indust
- Page 285 and 286: Municipal Study 2011$3.00Standard I
- Page 287 and 288: Municipal Study 2011Standard Indust
- Page 289 and 290: Municipal Study 2011Large Industria
- Page 291 and 292: Municipal Study 2011Large Industria
- Page 293 and 294: Municipal Study 2011Large Industria
- Page 295 and 296: Municipal Study 2011Large Industria
- Page 297 and 298: Industrial Comparisons - Industrial
- Page 299 and 300: Municipal Study 2011Industrial Comp
- Page 301 and 302: Municipal Study 2011Industrial Comp
- Page 303 and 304: Municipal Study 2011Industrial Comp
- Page 305 and 306: Municipal Study 2011Industrial Summ
- Page 307 and 308: Municipal Study 2011Industrial Summ
- Page 309 and 310: Municipal Study 2011Water/Wastewate
- Page 311 and 312: Municipal Study 2011Water and Waste
- Page 313 and 314: Municipal Study 2011Comparison of R
- Page 315 and 316: Municipal Study 2011Comparison of T
- Page 317: Municipal Study 2011Comparison of W
- Page 321 and 322: Municipal Study 2011Comparison of W
- Page 323 and 324: Water/Wastewater Costs as a Percent
- Page 325 and 326: Municipal Study 2011Water and Waste
- Page 327 and 328: Municipal Study 2011Water and Waste
- Page 329 and 330: Municipal Study 2011Wastewater Oper
- Page 331 and 332: Municipal Study 2011Wastewater Asse
- Page 333 and 334: Municipal Study 2011Water Reserves
- Page 335 and 336: Municipal Study 2011Wastewater Rese
- Page 337 and 338: Municipal Study 2011Wastewater Debt
- Page 339 and 340: Municipal Study 2011Water Net Finan
- Page 341 and 342: Municipal Study 2011Wastewater Net
- Page 343 and 344: Municipal Study 2011Water MPMPs Con
- Page 345 and 346: Municipal Study 2011Wastewater MPMP
- Page 347 and 348: Municipal Study 2011Taxes and Water
- Page 349 and 350: Average Household Income and Dwelli
- Page 351 and 352: Property Taxes as a Percentage of I
- Page 353 and 354: Municipal Study 2011Total Municipal
- Page 355 and 356: Municipal Study 2011Total Municipal
- Page 357 and 358: Municipal Study 2011Economic Develo
- Page 359 and 360: Municipal Study 2011Section 4 of th
- Page 361 and 362: Municipal Study 2011Business Retent
- Page 363 and 364: Municipal Study 2011Business Retent
- Page 365 and 366: Municipal Study 2011Business Retent
- Page 367 and 368: Municipal Study 2011Business Retent
- Page 369 and 370:
Municipal Study 2011Business Retent
- Page 371 and 372:
Municipal Study 2011Business Retent
- Page 373 and 374:
Municipal Study 2011Business Retent
- Page 375 and 376:
Municipal Study 2011Business Retent
- Page 377 and 378:
Municipal Study 2011Business Retent
- Page 379 and 380:
Municipal Study 2011Business Retent
- Page 381 and 382:
Municipal Study 2011Business Retent
- Page 383 and 384:
Municipal Study 2011Business Retent
- Page 385 and 386:
Municipal Study 2011Downtown/Area S
- Page 387 and 388:
Municipal Study 2011Downtown/Area S
- Page 389 and 390:
Municipal Study 2011Downtown/Area S
- Page 391 and 392:
Municipal Study 2011MunicipalityCor
- Page 393 and 394:
Municipal Study 2011MunicipalityKit
- Page 395 and 396:
Municipal Study 2011Downtown/Area S
- Page 397 and 398:
Municipal Study 2011Downtown/Area S
- Page 399 and 400:
Municipal Study 2011Downtown/Area S
- Page 401 and 402:
Municipal Study 2011WellandWhitbyWh
- Page 403 and 404:
Municipal Study 2011Brownfield Rede
- Page 405 and 406:
Municipal Study 2011Brownfield Rede
- Page 407 and 408:
Municipal Study 2011Brownfield Rede
- Page 409 and 410:
Industrial ParksMunicipal Study 201
- Page 411:
Industrial ParksMunicipal Study 201