SP60 Series - X-Rite
SP60 Series - X-Rite
SP60 Series - X-Rite

Create successful ePaper yourself
Turn your PDF publications into a flip-book with our unique Google optimized e-Paper software.
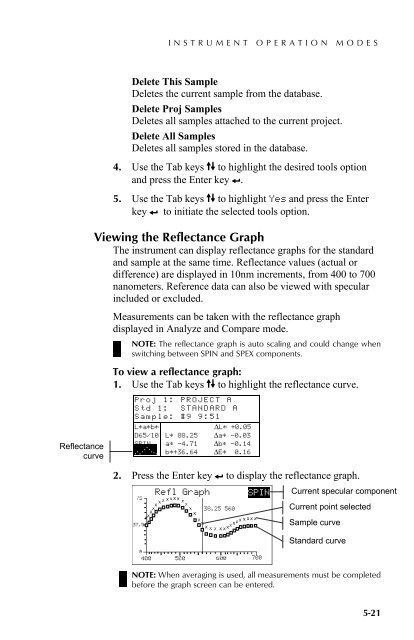
INSTRUMENT OPERATION MODESDelete This SampleDeletes the current sample from the database.Delete Proj SamplesDeletes all samples attached to the current project.Delete All SamplesDeletes all samples stored in the database.4. Use the Tab keys $@ to highlight the desired tools optionand press the Enter key #.5. Use the Tab keys $@ to highlight Yes and press the Enterkey # to initiate the selected tools option.5.3.9 Viewing the Reflectance GraphThe instrument can display reflectance graphs for the standardand sample at the same time. Reflectance values (actual ordifference) are displayed in 10nm increments, from 400 to 700nanometers. Reference data can also be viewed with specularincluded or excluded.Measurements can be taken with the reflectance graphdisplayed in Analyze and Compare mode.ReflectancecurveNOTE: The reflectance graph is auto scaling and could change whenswitching between SPIN and SPEX components.To view a reflectance graph:1. Use the Tab keys $@ to highlight the reflectance curve.Proj 1: PROJECT AStd 1: STANDARD ASample: #9 9:51L*a*b*ΔL* +0.05D65/10 L* 88.25 Δa* —0.03SPIN a* —4.71 Δb* —0.14. . . ... . ...b*+36.64 ΔE* 0.162. Press the Enter key # to display the reflectance graph.Refl Graph SPIN37.538.25 560Current specular componentCurrent point selectedSample curveStandard curveNOTE: When averaging is used, all measurements must be completedbefore the graph screen can be entered.5-21