Getting Started with WebSphere Application Server

You also want an ePaper? Increase the reach of your titles
YUMPU automatically turns print PDFs into web optimized ePapers that Google loves.
186 <strong>Getting</strong> <strong>Started</strong> <strong>with</strong> <strong>WebSphere</strong> <strong>Application</strong> <strong>Server</strong> Community Edition<br />
DefaultThreadPool in the current release. Community Edition might migrate these<br />
components to use DefaultThreadPool in the future.<br />
10.3.2 Monitoring thread pools<br />
To choose the optimum value for pool sizes, you need to monitor the current utilization of<br />
thread pools. You can monitor thread pools using the administrative console:<br />
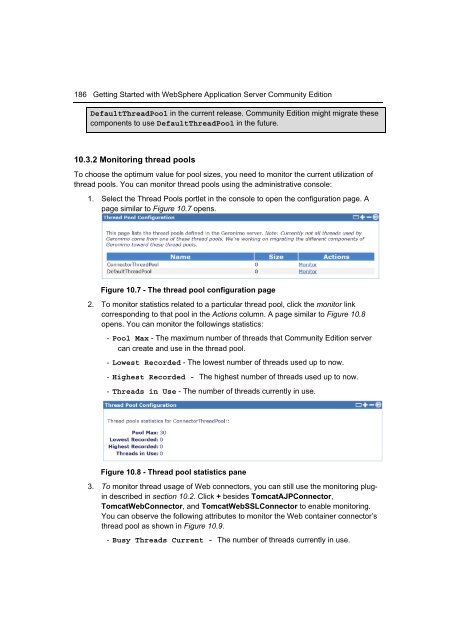
1. Select the Thread Pools portlet in the console to open the configuration page. A<br />
page similar to Figure 10.7 opens.<br />
Figure 10.7 - The thread pool configuration page<br />
2. To monitor statistics related to a particular thread pool, click the monitor link<br />
corresponding to that pool in the Actions column. A page similar to Figure 10.8<br />
opens. You can monitor the followings statistics:<br />
- Pool Max - The maximum number of threads that Community Edition server<br />
can create and use in the thread pool.<br />
- Lowest Recorded - The lowest number of threads used up to now.<br />
- Highest Recorded - The highest number of threads used up to now.<br />
- Threads in Use - The number of threads currently in use.<br />
Figure 10.8 - Thread pool statistics pane<br />
3. To monitor thread usage of Web connectors, you can still use the monitoring plugin<br />
described in section 10.2. Click + besides TomcatAJPConnector,<br />
TomcatWebConnector, and TomcatWebSSLConnector to enable monitoring.<br />
You can observe the following attributes to monitor the Web container connector’s<br />
thread pool as shown in Figure 10.9.<br />
- Busy Threads Current - The number of threads currently in use.