- Page 3 and 4:
G E T T I N G S T A R T E D W I T H
- Page 5 and 6:
Notices This information was develo
- Page 7 and 8:
Trademarks IBM, the IBM logo, and i
- Page 9 and 10:
3.8 Exercises .....................
- Page 11 and 12:
9.3.2 Changing port numbers .......
- Page 13 and 14:
13 Preface Keeping your skills curr
- Page 15:
The DB2 on Campus book series 15
- Page 18 and 19:
18 Getting Started with WebSphere A
- Page 21 and 22:
1 Chapter 1 - Introduction to WebSp
- Page 23 and 24:
Introduction to WebSphere Applicati
- Page 25 and 26:
Introduction to WebSphere Applicati
- Page 27 and 28:
Introduction to WebSphere Applicati
- Page 29 and 30:
Introduction to WebSphere Applicati
- Page 31:
Introduction to WebSphere Applicati
- Page 34 and 35:
34 Getting Started with WebSphere A
- Page 36 and 37:
36 Getting Started with WebSphere A
- Page 38 and 39:
38 Getting Started with WebSphere A
- Page 40 and 41:
40 Getting Started with WebSphere A
- Page 42 and 43:
42 Getting Started with WebSphere A
- Page 44 and 45:
44 Getting Started with WebSphere A
- Page 47 and 48:
3 Chapter 3 - Development with Comm
- Page 49 and 50:
Chapter 3 - Development with Commun
- Page 51 and 52:
Chapter 3 - Development with Commun
- Page 53 and 54:
Chapter 3 - Development with Commun
- Page 55 and 56:
Chapter 3 - Development with Commun
- Page 57 and 58:
Chapter 3 - Development with Commun
- Page 59 and 60:
Chapter 3 - Development with Commun
- Page 61 and 62:
Chapter 3 - Development with Commun
- Page 63 and 64:
Chapter 3 - Development with Commun
- Page 65 and 66:
4 Chapter 4 - Working with database
- Page 67 and 68:
Chapter 4 - Working with databases
- Page 69 and 70:
Chapter 4 - Working with databases
- Page 71 and 72:
Chapter 4 - Working with databases
- Page 73 and 74:
Chapter 4 - Working with databases
- Page 75 and 76:
Chapter 4 - Working with databases
- Page 77 and 78:
Chapter 4 - Working with databases
- Page 79 and 80:
Chapter 4 - Working with databases
- Page 81 and 82:
Chapter 4 - Working with databases
- Page 83 and 84:
Chapter 4 - Working with databases
- Page 85 and 86:
Chapter 4 - Working with databases
- Page 87 and 88:
Chapter 4 - Working with databases
- Page 89 and 90:
5 Chapter 5 - Enterprise Java Beans
- Page 91 and 92:
1. Define local and remote interfac
- Page 93 and 94:
Chapter 5 - Enterprise Java Beans 9
- Page 95 and 96:
Chapter 5 - Enterprise Java Beans 9
- Page 97 and 98:
Note: Chapter 5 - Enterprise Java B
- Page 99 and 100:
Chapter 5 - Enterprise Java Beans 9
- Page 101 and 102:
Chapter 5 - Enterprise Java Beans 1
- Page 103 and 104:
Chapter 5 - Enterprise Java Beans 1
- Page 105 and 106:
Chapter 5 - Enterprise Java Beans 1
- Page 107 and 108:
Chapter 5 - Enterprise Java Beans 1
- Page 109 and 110:
6 Chapter 6 - Messaging Messaging i
- Page 111 and 112:
Chapter 6 - Messaging 111 3. Messag
- Page 113 and 114:
Chapter 6 - Messaging 113 2. Get JM
- Page 115 and 116:
Chapter 6 - Messaging 115 Figure 6.
- Page 117 and 118:
Chapter 6 - Messaging 117 Figure 6.
- Page 119 and 120:
Chapter 6 - Messaging 119 For examp
- Page 121 and 122:
textMessage.getText()); } catch (JM
- Page 123 and 124:
Chapter 6 - Messaging 123 3. Copy t
- Page 125:
Chapter 6 - Messaging 125 D. Messag
- Page 128 and 129:
128 Getting Started with WebSphere
- Page 130 and 131:
130 Getting Started with WebSphere
- Page 132 and 133:
132 Getting Started with WebSphere
- Page 134 and 135:
134 Getting Started with WebSphere
- Page 136 and 137:
136 Getting Started with WebSphere
- Page 138 and 139: 138 Getting Started with WebSphere
- Page 140 and 141: 140 Getting Started with WebSphere
- Page 142 and 143: 142 Getting Started with WebSphere
- Page 144 and 145: 144 Getting Started with WebSphere
- Page 146 and 147: 146 Getting Started with WebSphere
- Page 148 and 149: 148 Getting Started with WebSphere
- Page 150 and 151: 150 Getting Started with WebSphere
- Page 152 and 153: 152 Getting Started with WebSphere
- Page 154 and 155: 154 Getting Started with WebSphere
- Page 156 and 157: 156 Getting Started with WebSphere
- Page 158 and 159: 158 Getting Started with WebSphere
- Page 161: PART III - ADMINISTERING COMMUNITY
- Page 164 and 165: 164 Getting Started with WebSphere
- Page 166 and 167: 166 Getting Started with WebSphere
- Page 168 and 169: 168 Getting Started with WebSphere
- Page 170 and 171: 170 Getting Started with WebSphere
- Page 172 and 173: 172 Getting Started with WebSphere
- Page 174 and 175: 174 Getting Started with WebSphere
- Page 176 and 177: 176 Getting Started with WebSphere
- Page 178 and 179: 178 Getting Started with WebSphere
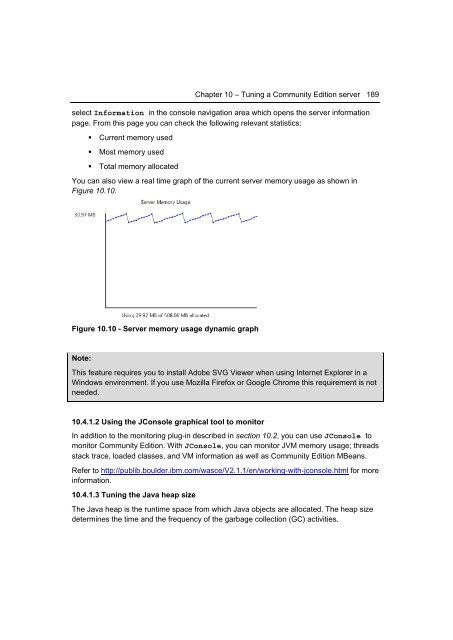
- Page 181 and 182: 10 Chapter 10 - Tuning a Community
- Page 183 and 184: Chapter 10 - Tuning a Community Edi
- Page 185 and 186: Chapter 10 - Tuning a Community Edi
- Page 187: Chapter 10 - Tuning a Community Edi
- Page 191 and 192: 10.4.2 Operating system tuning Chap
- Page 193: Chapter 10 - Tuning a Community Edi
- Page 196 and 197: 196 Getting Started with WebSphere
- Page 198 and 199: 198 Getting Started with WebSphere
- Page 200 and 201: 200 Getting Started with WebSphere
- Page 202 and 203: 202 Getting Started with WebSphere
- Page 204 and 205: 204 Getting Started with WebSphere
- Page 206 and 207: 206 Getting Started with WebSphere
- Page 208 and 209: 208 Getting Started with WebSphere
- Page 211 and 212: A Appendix A - Solutions to review
- Page 213 and 214: Appendix A - Solutions to review qu
- Page 215 and 216: Appendix A - Solutions to review qu
- Page 217 and 218: Appendix A - Solutions to review qu
- Page 219 and 220: B Appendix B - Up and running with
- Page 221 and 222: Appendix B - Up and running with DB
- Page 223 and 224: 4. The following is performed by de
- Page 225 and 226: Appendix B - Up and running with DB
- Page 227 and 228: Appendix B - Up and running with DB
- Page 229 and 230: Appendix B - Up and running with DB
- Page 231 and 232: Appendix B - Up and running with DB
- Page 233 and 234: Appendix B - Up and running with DB
- Page 235: C Appendix C - Using the sample cod
- Page 238 and 239:
238 Getting Started with WebSphere
- Page 240:
240 Getting Started with WebSphere