

bbc 2015
BBC2015_booklet
BBC2015_booklet

Create successful ePaper yourself
Turn your PDF publications into a flip-book with our unique Google optimized e-Paper software.
BeNeLux Bioinformatics Conference – Antwerp, December 7-8 <strong>2015</strong><br />
Abstract ID: P<br />
Poster<br />
10th Benelux Bioinformatics Conference <strong>bbc</strong> <strong>2015</strong><br />
P57. I-PV: A CIRCOS MODULE FOR INTERACTIVE PROTEIN<br />
SEQUENCE VISUALIZATION<br />
Ibrahim Tanyalcin 1,2* , Carla Al Assaf 3 , Alexander Gheldof 1 , Katrien Stouffs 1,4 , Willy Lissens 1,4 & Anna C. Jansen 5,2 .<br />
Center for Medical Genetics, UZ Brussel, Brussels, Belgium 1 ; Neurogenetics Research Group, Vrije Universiteit Brussel,<br />
Brussels, Belgium 2 ; Center for Human Genetics, KU Leuven and University Hospitals Leuven, 3000 Leuven, Belgium 3 ;<br />
Reproduction, Genetics and Regenerative Medicine, Vrije Universiteit Brussel, Brussels, Belgium 4 ; Pediatric Neurology<br />
Unit, Department of Pediatrics, UZ Brussel, Brussels, Belgium 5 . *ibrahim.tanyalcin@i-pv.org or itanyalc@vub.ac.be<br />
Summary: Today’s genome browsers and protein databanks supply vast amounts of information about proteins. The<br />
challenge is to concisely bring together this information in an interactive and easy to generate format.<br />
Availability and Implementation: We have developed an interactive CIRCOS module called i-PV to visualize user<br />
supplied protein sequence, conservation and SNV data in a live presentable format. I-PV can be downloaded from<br />
http://www.i-pv.org.<br />
INTRODUCTION<br />
Today’s genome browsers and protein databanks supply<br />
vast amount of information about both the structural<br />
annotation and the single nucleotide variants (SNV) in<br />
genes. The challenge is to concisely bring together this<br />
information in an interactive and easy to generate format.<br />
Thus, we have developed an interactive CIRCOS<br />
(Krzywinski et al.) module combined with D3 (Bostock et<br />
al.) and plain javascript called i-PV to visualize user<br />
supplied protein sequence, conservation and SNV data<br />
while significantly easing and automating input file<br />
requirements and generation.<br />
METHODS<br />
To use i-PV, only 4 text files (with “.txt” extension) have<br />
to be supplied to the software: conservation scores,<br />
protein and cDNA sequences, and SNVs/Indels files.<br />
Protein and cDNA (or mRNA) sequence files are supplied<br />
in fasta format whereas SNP/Indel fıles are provided as<br />
annotated vcf file (Variant Call Format). The conservation<br />
scores are simply array of numbers separated by newline<br />
characters. The input files are supplied to i-PV, data are<br />
automatically checked for errors or duplicates and<br />
matched against the user provided fasta files, and then an<br />
interactive html file containing the graph is automatically<br />
generated as shown in Fig.1.<br />
RESULTS & DISCUSSION<br />
Many sequence visualization tools focus on certain aspects<br />
of proteins such as conservation, variations, sequence<br />
alignments or topology. While all these tools are very<br />
useful in their own right, we pursued a more interactivity<br />
based design. Therefore, i-PV is not solely designed for<br />
visualization but also for live presentable graphs and<br />
information that can selectively be displayed and<br />
customized. I-PV combines major sources of information<br />
under one html file that is easy to generate and share on<br />
both desktop and mobile environments.<br />
Last but not least, many visualization tools are based on<br />
rectangular-scroll based representation of information<br />
which does not deliver a “wide angle” view of the<br />
sequence data unlike circular visualization. However, as<br />
like all other types of visualizations, there are also<br />
limitations for circular graphs when it comes to<br />
conveniently zoom in to a particular region or visually<br />
align tracks with different radii. We intend to further<br />
develop this software with several other features based on<br />
end user needs. The current version of i-PV can be<br />
downloaded from http://www.i-pv.org.<br />
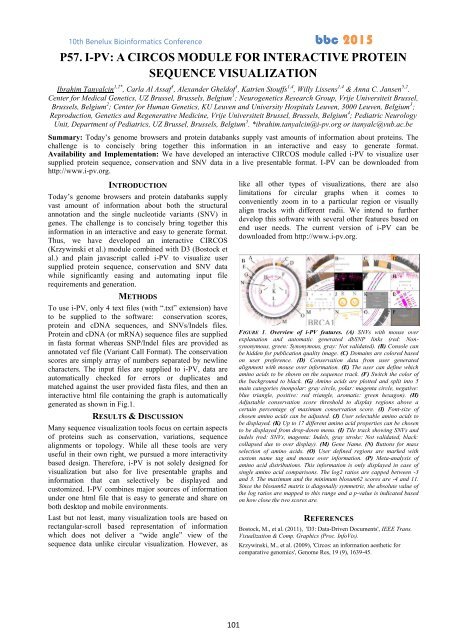
FIGURE 1. Overview of i-PV features. (A) SNVs with mouse over<br />
explanation and automatic generated dbSNP links (red: Nonsynonymous,<br />
green: Synonymous, gray: Not validated). (B) Console can<br />
be hidden for publication quality image. (C) Domains are colored based<br />
on user preference. (D) Conservation data from user generated<br />
alignment with mouse over information. (E) The user can define which<br />
amino acids to be shown on the sequence track. (F) Switch the color of<br />
the background to black. (G) Amino acids are plotted and split into 5<br />
main categories (nonpolar: gray circle, polar: magenta circle, negative:<br />
blue triangle, positive: red triangle, aromatic: green hexagon). (H)<br />
Adjustable conservation score threshold to display regions above a<br />
certain percentage of maximum conservation score. (I) Font-size of<br />
chosen amino acids can be adjusted. (J) User selectable amino acids to<br />
be displayed. (K) Up to 17 different amino acid properties can be chosen<br />
to be displayed from drop-down menu. (I) Tile track showing SNVs and<br />
indels (red: SNVs, magenta: Indels, gray stroke: Not validated, black:<br />
collapsed due to over display). (M) Gene Name. (N) Buttons for mass<br />
selection of amino acids. (O) User defined regions are marked with<br />
custom name tag and mouse over information. (P) Meta-analysis of<br />
amino acid distributions. This information is only displayed in case of<br />
single amino acid comparisons. The log2 ratios are capped between -3<br />
and 3. The maximum and the minimum blosum62 scores are -4 and 11.<br />
Since the blosum62 matrix is diagonally symmetric, the absolute value of<br />
the log ratios are mapped to this range and a p-value is indicated based<br />
on how close the two scores are.<br />
REFERENCES<br />
Bostock, M., et al. (2011), 'D3: Data-Driven Documents', IEEE Trans.<br />
Visualization & Comp. Graphics (Proc. InfoVis).<br />
Krzywinski, M., et al. (2009), 'Circos: an information aesthetic for<br />
comparative genomics', Genome Res, 19 (9), 1639-45.<br />
101