

bbc 2015
BBC2015_booklet
BBC2015_booklet

Create successful ePaper yourself
Turn your PDF publications into a flip-book with our unique Google optimized e-Paper software.
BeNeLux Bioinformatics Conference – Antwerp, December 7-8 <strong>2015</strong><br />
Abstract ID: O23<br />
Oral presentation<br />
10th Benelux Bioinformatics Conference <strong>bbc</strong> <strong>2015</strong><br />
O23. INTERACTIVE VCF COMPARISON USING SPARK NOTEBOOK<br />
Thomas Moerman 1,2,5* , Dries Decap 3,5 , Toni Verbeiren 2,5 , Jan Fostier 3,5 , Joke Reumers 4,5 , Jan Aerts 2,5 .<br />
Advanced Database Research and Modeling (ADReM), University of Antwerp 1 ; Visual Data Analysis Lab, ESAT –<br />
STADIUS, Dept. of Electrical Engineering, KU Leuven – iMinds Medical IT 2 ; Department of Information Technology,<br />
Ghent University – iMinds, Gaston Crommenlaan 8 bus 201, 9050 Ghent, Belgium 3 ; Janssen Research & Development,<br />
a division of Janssen Pharmaceutica N.V., 2340 Beerse, Belgium 4 ; ExaScience Life Lab, Kapeldreef 75, 3001 Leuven,<br />
Belgium 5 . * thomas.moerman@esat.kuleuven.be<br />
Researchers benefit greatly from tools that allow hands-on, interactive and visual experimentation with data, unimpeded<br />
by setup complexities nor scaling issues resulting from large data sizes. In our contribution we present an implementation<br />
of an interactive VCF comparison tool, making use of a technology stack based on Apache Spark [1], Big Data<br />
Genomics Adam [2] and Spark Notebook [3].<br />
INTRODUCTION<br />
Current genomics data formats and processing pipelines<br />
are not designed to scale well to large datasets [1]. They<br />
were also not conceived to be used in an interactive<br />
environment. The bioinformatics field typically struggles<br />
with these difficulties as high-throughput, next-generation<br />
sequencing jobs produce large data files. Although many<br />
high-quality bioinformatics processing tools exist, it is<br />
often hard to express analyses in a consolidated and<br />
reproducible fashion. These tools typically do not allow to<br />
interactively iterate on an analysis while visualizing<br />
results.<br />
OBJECTIVE<br />
Analysis tools preferably provide the expressive power to<br />
define ad hoc queries on data. Biologists or clinical<br />
researchers, when dealing with genomic variants encoded<br />
in VCF files, typically perform queries comparing one<br />
protocol to another, tumor to normal, treated to untreated<br />
cell lines and so on. Ideally these comparisons make use<br />
of all quality-related metrics stored in VCF files (e.g.<br />
coverage depth, quality score) as well as the actual region<br />
annotations (e.g. repeat regions, exonic regions) and<br />
generate visual output. We aim to implement a tool that<br />
provides the necessary expressiveness as well as the<br />
computational power needed for making these types of<br />
analyses practical and interactive.<br />
APPROACH<br />
Recent advances in computation platform technology<br />
(Spark) and notebook technologies (Spark Notebook)<br />
enable orchestration of distributed jobs on cluster<br />
infrastructure from a programmable environment running<br />
in a browser. These technologies, combined with Adam<br />
[2], a library specifically designed for processing nextgeneration<br />
sequencing data, provide the necessary<br />
architectural bedrock for our purposes.<br />
Analyses are expressed in a high-level programming<br />
language (Scala), operating on specialized data structures<br />
(Spark resilient distributed datasets, or RDDs [1]) that<br />
make abstraction of the complexity of defining distributed<br />
computations on data sets too large for single node<br />
processing. Adam meets the need for an explicit data<br />
schema for abstraction of the different bioinformatics file<br />
formats.<br />
RESULTS & CONTRIBUTIONS<br />
Our work focuses on the pairwise comparison of annotated<br />
VCF files. Our contributions consist of two open-source<br />
Scala libraries: VCF-comp [4] and Adam-FX [5]. VCFcomp<br />
implements the concordance by variant position<br />
algorithm, which segregates the variants from two VCF<br />
inputs (A, B) into 5 categories: A/B-unique, concordant<br />
(equal variants on position) and A/B-discordant (different<br />
variants on position). This results in a distributed data<br />
structure from which we project visualizations, presented<br />
to the user by means of the Spark Notebook interface.<br />
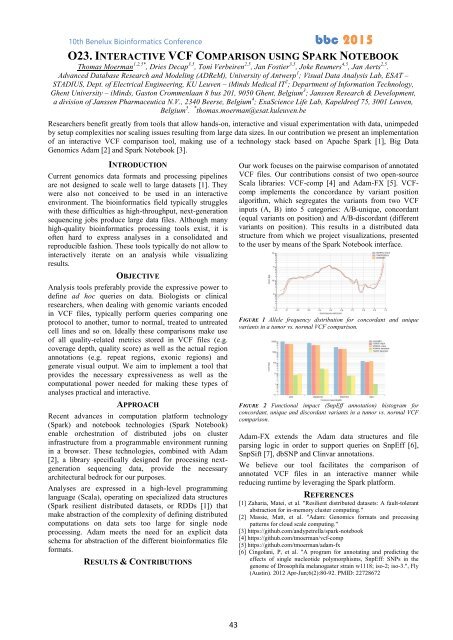
FIGURE 1 Allele frequency distribution for concordant and unique<br />
variants in a tumor vs. normal VCF comparison.<br />
FIGURE 2 Functional impact (SnpEff annotation) histogram for<br />
concordant, unique and discordant variants in a tumor vs. normal VCF<br />
comparison.<br />
Adam-FX extends the Adam data structures and file<br />
parsing logic in order to support queries on SnpEff [6],<br />
SnpSift [7], dbSNP and Clinvar annotations.<br />
We believe our tool facilitates the comparison of<br />
annotated VCF files in an interactive manner while<br />
reducing runtime by leveraging the Spark platform.<br />
REFERENCES<br />
[1] Zaharia, Matei, et al. "Resilient distributed datasets: A fault-tolerant<br />
abstraction for in-memory cluster computing."<br />
[2] Massie, Matt, et al. "Adam: Genomics formats and processing<br />
patterns for cloud scale computing."<br />
[3] https://github.com/andypetrella/spark-notebook<br />
[4] https://github.com/tmoerman/vcf-comp<br />
[5] https://github.com/tmoerman/adam-fx<br />
[6] Cingolani, P, et al. "A program for annotating and predicting the<br />
effects of single nucleotide polymorphisms, SnpEff: SNPs in the<br />
genome of Drosophila melanogaster strain w1118; iso-2; iso-3.", Fly<br />
(Austin). 2012 Apr-Jun;6(2):80-92. PMID: 22728672<br />
43