

bbc 2015
BBC2015_booklet
BBC2015_booklet

You also want an ePaper? Increase the reach of your titles
YUMPU automatically turns print PDFs into web optimized ePapers that Google loves.
BeNeLux Bioinformatics Conference – Antwerp, December 7-8 <strong>2015</strong><br />
Abstract ID: O11<br />
Oral presentation<br />
10th Benelux Bioinformatics Conference <strong>bbc</strong> <strong>2015</strong><br />
O11. ANALYSIS OF MASS SPECTROMETRY QUALITY CONTROL METRICS<br />
Wout Bittremieux 1 , Pieter Meysman 1 , Lennart Martens 2 , Bart Goethals 1 , Dirk Valkenborg 3 & Kris Laukens 1 .<br />
Advanced Database Research and Modeling (ADReM) & Biomedical Informatics Research Center Antwerp (biomina),<br />
University of Antwerp / Antwerp University Hospital 1 ; Department of Biochemistry & Department of Medical Protein<br />
Research, Ghent University / VIB 2 ; Flemish Institute for Technological Research (VITO) 3 .<br />
* wout.bittremieux@uantwerpen.be<br />
Mass-spectrometry-based proteomics is a powerful analytical technique to identify complex protein samples, however,<br />
its results are still subject to a large variability. Lately several quality control metrics have been introduced to assess the<br />
performance of a mass spectrometry experiment. Unfortunately these metrics are generally not sufficiently thoroughly<br />
understood. For this reason, we present a few powerful techniques to analyse multiple experiments based on quality<br />
control metrics, identify low-performance experiments, and provide an interpretation of outlying experiments.<br />
INTRODUCTION<br />
Mass-spectrometry-based proteomics is a powerful<br />
analytical technique that can be used to identify complex<br />
protein samples. Despite many technological and<br />
computational advances, performing a mass spectrometry<br />
experiment is still a highly complicated task and its results<br />
are subject to a large variability. To understand and<br />
evaluate how technical variability affects the results of an<br />
experiment, lately several quality control (QC) and<br />
performance metrics have been introduced. Unfortunately,<br />
despite the availability of such QC metrics covering a<br />
wide range of qualitative information, a systematic<br />
approach to quality control is often still lacking.<br />
As most quality control tools are able to generate several<br />
dozens of metrics, any single experiment can be<br />
characterized by multiple QC metrics. Therefore it is<br />
often not clear which metrics are most interesting in<br />
general, or even which metrics are relevant in a specific<br />
situation. To take into account the multidimensional data<br />
space formed by the numerous metrics, we have applied<br />
advanced techniques to visualize, analyze, and interpret<br />
the QC metrics.<br />
METHODS<br />
Outlier detection can be used to detect deviating<br />
experiments with a low performance or a high level of<br />
(unexplained) variability. These outlying experiments can<br />
subsequently be analyzed to discover the source of the<br />
reduced performance and to enhance the quality of future<br />
experiments.<br />
However, it is insufficient to know that a specific<br />
experiment is an outlier; it is also of vital importance to<br />
know the reason. To understand why an experiment is an<br />
outlier, we have used the subspace of QC metrics in which<br />
the outlying experiment can be differentiated from the<br />
other experiments. This provides crucial information on<br />
how to interpret an outlier, which can be used by domain<br />
experts to increase interpretability and investigate the<br />
performance of the experiment.<br />
RESULTS & DISCUSSION<br />
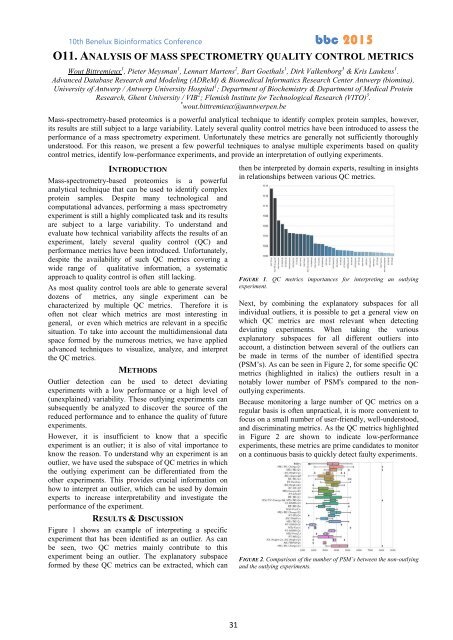
Figure 1 shows an example of interpreting a specific<br />
experiment that has been identified as an outlier. As can<br />
be seen, two QC metrics mainly contribute to this<br />
experiment being an outlier. The explanatory subspace<br />
formed by these QC metrics can be extracted, which can<br />
then be interpreted by domain experts, resulting in insights<br />
in relationships between various QC metrics.<br />
FIGURE 1. QC metrics importances for interpreting an outlying<br />
experiment.<br />
Next, by combining the explanatory subspaces for all<br />
individual outliers, it is possible to get a general view on<br />
which QC metrics are most relevant when detecting<br />
deviating experiments. When taking the various<br />
explanatory subspaces for all different outliers into<br />
account, a distinction between several of the outliers can<br />
be made in terms of the number of identified spectra<br />
(PSM’s). As can be seen in Figure 2, for some specific QC<br />
metrics (highlighted in italics) the outliers result in a<br />
notably lower number of PSM's compared to the nonoutlying<br />
experiments.<br />
Because monitoring a large number of QC metrics on a<br />
regular basis is often unpractical, it is more convenient to<br />
focus on a small number of user-friendly, well-understood,<br />
and discriminating metrics. As the QC metrics highlighted<br />
in Figure 2 are shown to indicate low-performance<br />
experiments, these metrics are prime candidates to monitor<br />
on a continuous basis to quickly detect faulty experiments.<br />
FIGURE 2. Comparison of the number of PSM’s between the non-outlying<br />
and the outlying experiments.<br />
31