

bbc 2015
BBC2015_booklet
BBC2015_booklet

You also want an ePaper? Increase the reach of your titles
YUMPU automatically turns print PDFs into web optimized ePapers that Google loves.
BeNeLux Bioinformatics Conference – Antwerp, December 7-8 <strong>2015</strong><br />
Abstract ID: O8<br />
Oral presentation<br />
10th Benelux Bioinformatics Conference <strong>bbc</strong> <strong>2015</strong><br />
O8. RANKED TILING BASED APPROACH TO DISCOVERING PATIENT<br />
SUBTYPES<br />
Thanh Le Van 1,* , Jimmy Van den Eynden 3 , Dries De Maeyer 2 , Ana Carolina Fierro 5 , Lieven Verbeke 5 , Matthijs van<br />
Leeuwen 4 , Siegfried Nijssen 1,4 , Luc De Raedt 1 & Kathleen Marchal 5,6 .<br />
Department of Computer Science 1 , Centre of Microbial and Plant Genetics 2 , KULeuven, Belgium; Department of<br />
Medical Biochemistry, University of Gothenburg 3 , Sweden; Leiden Institute for Advanced Computer Science 4 ,<br />
Universiteit Leiden, The Netherlands; Department of Plant Biotechnology and Bioinformatics 5 , Department of<br />
Information Technology, iMinds 6 , Ghent University, Belgium. * thanh.levan@cs.kuleuven.be<br />
Cancer is a heterogeneous disease consisting of many subtypes that usually have both shared and distinguishing<br />
mechanisms. To derive good subtypes, it is essential to have a computational model that can score their homogeneity<br />
from different angles, for example, mutated pathways and gene expression. In this paper, we introduce our ongoing work<br />
which studies a constraint-based optimisation model to discover patient subtypes as well as their perturbed pathways<br />
from mutation, transcription and interaction data. We propose a way to solve the optimisation problem based on<br />
constraint programming principles. Experiments on a TCGA breast cancer dataset demonstrate the promise of the<br />
approach.<br />
INTRODUCTION<br />
Discovering patient subtypes and understanding their<br />
mechanisms are essential to provide precise treatments to<br />
patients. There have been efforts to understand how<br />
mutation causes subtypes such as the work by Hofree et<br />
al., (2013). However, to the best knowledge of the authors,<br />
it is still an open question on how to combine mutation<br />
and expression data to derive good subtypes. Therefore,<br />
we study a new computation model that can discover<br />
subtypes as well as their specific mutated genes and<br />
expressed genes from mutation, transcription and<br />
interaction data.<br />
METHODS<br />
We conjecture that a subtype consists of a number of<br />
patients who have the same set of differentially expressed<br />
genes and a set of mutated genes that hit the same<br />
pathways.<br />
To find both mutations and expressions of patient subtypes,<br />
we extend our recent ranked tiling method (Le Van et al.,<br />
2014). Ranked tiling is a data mining method proposed to<br />
mine regions with high average rank values in a rank<br />
matrix. In this type of matrix, each row is a complete<br />
ranking of the columns. We find that rank matrices are a<br />
good abstraction for numeric data and are useful to<br />
integrate datasets that are at different scales.<br />
To apply the ranked tiling method, we first transform the<br />
given numeric expression matrix, where rows are<br />
expressed genes and columns are patients, into a ranked<br />
expression matrix. Then, we search for a region in the<br />
transformed matrix that has high average rank scores.<br />
However, different from the ranked tiling method, we<br />
impose a further constraint that the columns (patients) of<br />
the region should also have a number of mutated genes<br />
that have high rank scores in a network with respect to a<br />
network model. We formalise this as a constraint<br />
optimisation problem and use a constraint solver to solve<br />
it.<br />
RESULTS & DISCUSSION<br />
We apply our method on TCGA breast cancer dataset and<br />
discover eight subtypes. Compared to PAM50 annotations,<br />
our method divide the Basal subtype into three sub-groups<br />
named S2, S3 and S6. The LumA subtype is divided into<br />
04 smaller groups, namely, S1, S4, S7 and S8. Finally, our<br />
method could recover the Her2 subtype in S5.<br />
To validate the mined subtypes in the patient dimension,<br />
we assume PAM50 annotations are true labels for them.<br />
Then, grouping patients into subtypes can be seen as a<br />
multi-class prediction problem, for which we can calculate<br />
F1 score to measure the average accuracy. We also<br />
compare our scores with state-of-the-art, including<br />
iCluster+ (Mo, Q. et al., 2013), NBS (Hofree et al., 2013)<br />
and SNF (Wang B. et al., 2014). The result (not shown)<br />
illustrates that our subtypes are more homogeneous than<br />
the ones produced by iCluster+ and NBS and are<br />
comparable to those by SNF.<br />
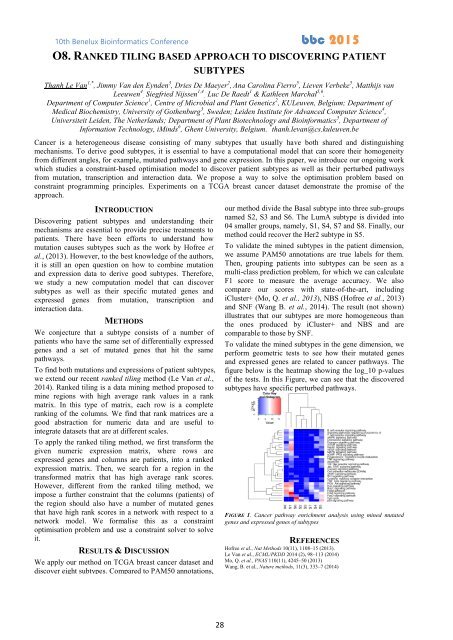
To validate the mined subtypes in the gene dimension, we<br />
perform geometric tests to see how their mutated genes<br />
and expressed genes are related to cancer pathways. The<br />
figure below is the heatmap showing the log_10 p-values<br />
of the tests. In this Figure, we can see that the discovered<br />
subtypes have specific perturbed pathways.<br />
FIGURE 1. Cancer pathway enrichment analysis using mined mutated<br />
genes and expressed genes of subtypes<br />
REFERENCES<br />
Hofree et al., Nat Methods 10(11), 1108–15 (2013).<br />
Le Van et al., ECML/PKDD 2014 (2), 98–113 (2014)<br />
Mo, Q. et al., PNAS 110(11), 4245–50 (2013)<br />
Wang, B. et al., Nature methods, 11(3), 333–7 (2014)<br />
28