

bbc 2015
BBC2015_booklet
BBC2015_booklet

Create successful ePaper yourself
Turn your PDF publications into a flip-book with our unique Google optimized e-Paper software.
BeNeLux Bioinformatics Conference – Antwerp, December 7-8 <strong>2015</strong><br />
Abstract ID: P<br />
Poster<br />
10th Benelux Bioinformatics Conference <strong>bbc</strong> <strong>2015</strong><br />
P10. FROM SNPS TO PATHWAYS: AN APPROACH TO STRENGTHEN<br />
BIOLOGICAL INTERPRETATION OF GWAS RESULTS<br />
Elisa Cirillo 1,* , Michiel Adriaens 2 & Chris T Evelo 1,2 .<br />
1 Department of Bioinformatics – BiGCaT, Maastricht University, The Netherlands<br />
2 Maastricht Centre for Systems Biology (MaCSBio), Maastricht University, The Netherlands<br />
* elisa.cirillo@maastrichtuniversity.nl<br />
Pathway and network analysis are established and powerful methods for providing a biological context for a variety of<br />
omics data, including transcriptomics, proteomics and metabolomics. These approaches could in theory also be a boon<br />
for the interpretation of genetic variation data, for instance in the context of Genome Wide Association Studies (GWAS),<br />
as it would allow the study of genetic variants in the context of the biological processes in which the implicated genes<br />
and proteins are involved. However, currently genetic variation data cannot easily be integrated into pathways.<br />
Additionally, it is not clear how to visualise and interpret genetic variation data once connected to pathway content. In<br />
this project we take up that challenge and aim to (i) visualise SNPs from a Type 2 Diabetes Mellitus (T2DM) GWAS<br />
dataset on pathways and (ii) generate and analyze a network of all associated genes and pathways. Together, this could<br />
enable a comprehensive pathway and network interpretation of genetic variations in the context of T2DM.<br />
INTRODUCTION<br />
GWAS has become a common approach for discovery of<br />
gene disease relationships, in particular for complex<br />
diseases like T2DM (Wellcome Trust Case Control,<br />
2009). However, biological interpretation remains a<br />
challenge, especially when it concerns connecting genetic<br />
findings with known biological processes. We wish to<br />
improve the interpretation of GWAS results, using a<br />
meaningful network representation that links SNPs to<br />
biological processes.<br />
METHODS<br />
We selected a GWAS data set related to T2DM from a<br />
meta GWAS resource for diseases created by Jhonson et<br />
al. (2009), and we extracted 1971 SNPs associated with<br />
T2DM.<br />
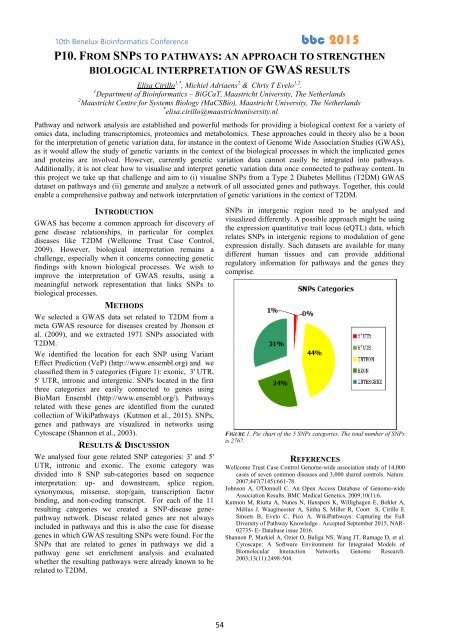
We identified the location for each SNP using Variant<br />
Effect Prediction (VeP) (http://www.ensembl.org) and we<br />
classified them in 5 categories (Figure 1): exonic, 3' UTR,<br />
5' UTR, intronic and intergenic. SNPs located in the first<br />
three categories are easily connected to genes using<br />
BioMart Ensembl (http://www.ensembl.org/). Pathways<br />
related with these genes are identified from the curated<br />
collection of WikiPathways (Kutmon et al., <strong>2015</strong>). SNPs,<br />
genes and pathways are visualized in networks using<br />
Cytoscape (Shannon et al., 2003).<br />
RESULTS & DISCUSSION<br />
We analysed four gene related SNP categories: 3' and 5'<br />
UTR, intronic and exonic. The exonic category was<br />
divided into 8 SNP sub-categories based on sequence<br />
interpretation: up- and downstream, splice region,<br />
synonymous, missense, stop/gain, transcription factor<br />
binding, and non-coding transcript. For each of the 11<br />
resulting categories we created a SNP-disease genepathway<br />
network. Disease related genes are not always<br />
included in pathways and this is also the case for disease<br />
genes in which GWAS resulting SNPs were found. For the<br />
SNPs that are related to genes in pathways we did a<br />
pathway gene set enrichment analysis and evaluated<br />
whether the resulting pathways were already known to be<br />
related to T2DM.<br />
SNPs in intergenic region need to be analysed and<br />
visualized differently. A possible approach might be using<br />
the expression quantitative trait locus (eQTL) data, which<br />
relates SNPs in intergenic regions to modulation of gene<br />
expression distally. Such datasets are available for many<br />
different human tissues and can provide additional<br />
regulatory information for pathways and the genes they<br />
comprise.<br />
FIGURE 1. Pie chart of the 5 SNPs categories. The total number of SNPs<br />
is 2767.<br />
REFERENCES<br />
Wellcome Trust Case Control Genome-wide association study of 14,000<br />
cases of seven common diseases and 3,000 shared controls. Nature.<br />
2007;447(7145):661-78.<br />
Johnson A, O'Donnell C. An Open Access Database of Genome-wide<br />
Association Results. BMC Medical Genetics. 2009;10(1):6.<br />
Kutmon M, Riutta A, Nunes N, Hanspers K, Willighagen E, Bohler A,<br />
Mélius J, Waagmeester A, Sinha S, Miller R, Coort S, Cirillo E<br />
Smeets B, Evelo C, Pico A. WikiPathways: Capturing the Full<br />
Diversity of Pathway Knowledge . Accepted September <strong>2015</strong>, NAR-<br />
02735- E- Database issue 2016.<br />
Shannon P, Markiel A, Ozier O, Baliga NS, Wang JT, Ramage D, et al.<br />
Cytoscape: A Software Environment for Integrated Models of<br />
Biomolecular Interaction Networks. Genome Research.<br />
2003;13(11):2498-504.<br />
54