

bbc 2015
BBC2015_booklet
BBC2015_booklet

Create successful ePaper yourself
Turn your PDF publications into a flip-book with our unique Google optimized e-Paper software.
BeNeLux Bioinformatics Conference – Antwerp, December 7-8 <strong>2015</strong><br />
Abstract ID: O13<br />
Oral presentation<br />
10th Benelux Bioinformatics Conference <strong>bbc</strong> <strong>2015</strong><br />
O13. AUTOMATED ANATOMICAL INTERPRETATION OF DIFFERENCES<br />
BETWEEN IMAGING MASS SPECTROMETRY EXPERIMENTS<br />
Nico Verbeeck 1* , Jeffrey Spraggins ,2 , Yousef El Aalamat 3,4 , Junhai Yang 2 ,<br />
Richard M. Caprioli 2 , Bart De Moor 3,4 ,Etienne Waelkens 5,6 & Raf Van de Plas 1,2 .<br />
Delft Center for Systems and Control (DCSC), Delft University of Technology 1 ; Mass Spectrometry Research Center<br />
(MSRC),Vanderbilt University 2 ; STADIUS Center for Dynamical Systems, Signal Processing, and Data Analytics, Dept.<br />
of Electrical Engineering (ESAT), KU Leuven 3 ; iMinds Medical IT, KU Leuven 4 ; Dept. of Cellular and Molecular<br />
Medicine, KU Leuven 5 ; Sybioma, KU Leuven 6 . * n.verbeeck@tudelft.nl<br />
Imaging mass spectrometry (IMS) is a powerful molecular imaging technology that generates large amounts of data,<br />
making manual analysis often practically infeasible. In this work we aid the differential analysis of multiple IMS datasets<br />
by linking these data to an anatomical atlas. Using matrix factorization based multivariate analysis techniques, we are<br />
able to identify differential biomolecular signals between individual tissue samples in an obesity case study on mouse<br />
brain. The resulting differential signals are then automatically interpreted in terms of anatomical structures using a<br />
convex optimization approach and the Allen Mouse Brain Atlas. The automated anatomical interpretation facilitates<br />
much deeper exploration by the biomedical expert for these types of very rich data sets.<br />
INTRODUCTION<br />
Imaging Mass Spectrometry (IMS) is a relatively new<br />
molecular imaging technology that enables a user to<br />
monitor the spatial distributions of hundreds of<br />
biomolecules in a tissue slice simultaneously. This unique<br />
property makes IMS an immensely valuable technology in<br />
biomedical research. However, it also leads to very large<br />
amounts of data in a single analysis (e.g. >1 TB), making<br />
manual analysis of these data increasingly impractical. In<br />
order to aid the exploration of these data, we have recently<br />
developed a framework that integrates IMS data with an<br />
anatomical atlas. The framework uses the anatomical data<br />
in the atlas to automatically interpret the IMS data in terms<br />
of anatomical structures, and guides the user towards<br />
relevant findings within a single tissue section. In this<br />
work, we extend this framework towards the automated<br />
interpretation of biomolecular differences between<br />
multiple IMS datasets.<br />
METHODS<br />
We demonstrate our method on IMS data of multiple<br />
mouse brain sections, and use the Allen Mouse Brain<br />
Atlas as the curated anatomical data source that is linked<br />
to the MALDI-based IMS measurements. We spatially<br />
map the data of each individual IMS dataset to the<br />
anatomical atlas using both rigid and non-rigid registration<br />
techniques. This establishes a common reference space<br />
and allows for direct comparison of spatial locations<br />
between the different IMS datasets. Group Independent<br />
Component Analysis (GICA) is then used to automatically<br />
extract the differentially expressed biomolecular patterns,<br />
after which convex optimization is used to automatically<br />
interpret the differential components in terms of known<br />
anatomical structures (Verbeeck et al, 2014), directly<br />
listing the anatomical areas in which changes occur.<br />
RESULTS & DISCUSSION<br />
We demonstrate our approach in an obesity case study on<br />
mouse brain. All tissue sections are cryosectioned at 10<br />
μm and thaw-mounted onto ITO coated glass slides after<br />
which they are sublimated with CMBT matrix. MALDI<br />
IMS images are collected using the Bruker 15T solariX<br />
FTICR MS with a spatial resolution of 50 μm, collecting<br />
approximately 35,000 pixels per experiment.<br />
The IMS data of the different experiments are registered to<br />
the anatomical reference space provided by the Allen<br />
Mouse Brain Atlas, establishing an inter-experiment<br />
study-wide reference space. Analysis of the IMS<br />
measurements using GICA reveals multiple biomolecular<br />
patterns that differentiate between the various dietary<br />
conditions examined by the study. The retrieved<br />
differentially expressed biomolecular patterns are then<br />
translated to combinations of anatomical structures using<br />
our convex optimization approach, similar to what a<br />
human investigator intends to do. This automated<br />
interpretation of inter-experiment differences can serve as<br />
a great accelerator in the exploration of IMS data, as it<br />
avoids the time-and resource-intensive step of having a<br />
histological expert manually interpret the differential<br />
patterns.<br />
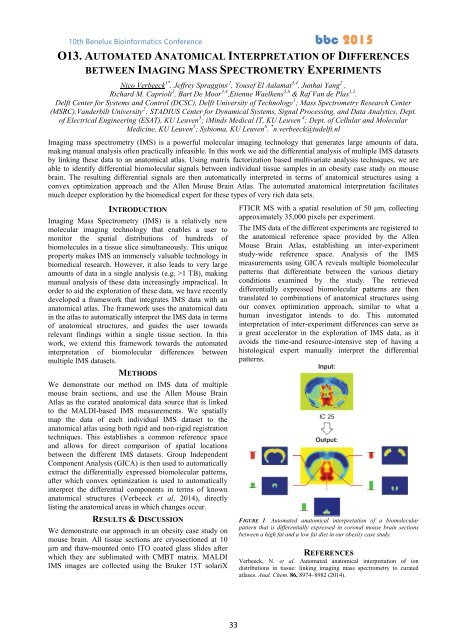
FIGURE 1. Automated anatomical interpretation of a biomolecular<br />
pattern that is differentially expressed in coronal mouse brain sections<br />
between a high fat and a low fat diet in our obesity case study.<br />
REFERENCES<br />
Verbeeck, N. et al. Automated anatomical interpretation of ion<br />
distributions in tissue: linking imaging mass spectrometry to curated<br />
atlases. Anal. Chem. 86, 8974–8982 (2014).<br />
33