

bbc 2015
BBC2015_booklet
BBC2015_booklet

You also want an ePaper? Increase the reach of your titles
YUMPU automatically turns print PDFs into web optimized ePapers that Google loves.
BeNeLux Bioinformatics Conference – Antwerp, December 7-8 <strong>2015</strong><br />
Abstract ID: P<br />
Poster<br />
10th Benelux Bioinformatics Conference <strong>bbc</strong> <strong>2015</strong><br />
P62. FLOREMI: SURVIVAL TIME PREDICTION<br />
BASED ON FLOW CYTOMETRY DATA<br />
Sofie Van Gassen 1,2,3* , Celine Vens 2,3,4 , Tom Dhaene 1 , Bart N. Lambrecht 2,3 & Yvan Saeys 2,3 .<br />
Department of Information Technology, Ghent University—iMinds 1 ; VIB Inflammation Research Center 2 ; Department of<br />
Respiratory Medicine, Ghent University 3 ; Department of Public Health and Primary Care, kU Leuven Kulak 4 .<br />
* sofie.vangassen@irc.vib-ugent.be<br />
Flow cytometry is a high-throughput technique for single cell analysis. It enables researchers and pathologists to study<br />
blood and tissue samples by measuring several cell properties, such as cell size, granularity and the presence of cellular<br />
markers. While this technique provides a wealth of information, it becomes hard to analyze all data manually. To<br />
investigate alternative automatic analysis methods, the FlowCAP challenges were organized. We will present an<br />
algorithm that obtained the best results on the FlowCAP IV challenge, predicting the time of progression to AIDS for<br />
HIV patients.<br />
INTRODUCTION<br />
The main task of the most recent FlowCAP IV challenge<br />
was a survival modeling challenge: participants had to<br />
predict the time of progression to AIDS for HIV patients,<br />
based on flow cytometry data of an unstimulated and a<br />
stimulated blood sample. Additionally, a secondary task<br />
was the identification of cell populations that could be<br />
indicative of this progression rate. Several challenges<br />
needed to be taken into account: the raw dataset was about<br />
20GB large and about eighty percent of the survival times<br />
were censored.<br />
METHODS<br />
We developed a new algorithm, FloReMi, which<br />
combined several preprocessing steps with a density based<br />
clustering algorithm, a feature selection step and a random<br />
survival forest (Van Gassen et al., <strong>2015</strong>).<br />
The input for our algorithm consisted of 2 flow cytometry<br />
samples for each patient: one unstimulated PBMC sample<br />
and one PBMC sample stimulated with HIV antigens. For<br />
each of these samples, 16 parameters were measured for<br />
hundreds of thousands of cells.<br />
First, we included quality control to remove erroneous<br />
measurements from the samples. We also made an<br />
automatic selection of live T cells to focus on the cells of<br />
interest in this specific flow cytometry staining.<br />
Once the dataset was cleaned up, we extracted features for<br />
each patient. This was done by clustering the cells using<br />
the flowDensity (Malek et al., <strong>2015</strong>) and flowType<br />
algorithms (Aghaeepour et al., 2012). These algorithms<br />
divide the values for each feature into either “high” or<br />
“low” and use all combinatorial options of “high”, “low”<br />
or “neutral” marker values to group the cells. This resulted<br />
in 3 10 different cell subsets.<br />
For each of these subsets, we computed the number of<br />
cells assigned to it and the mean fluorescence intensity for<br />
13 markers. Per patient, we collected these numbers for<br />
both samples and also computed the differences between<br />
the two. This resulted in a total of 2,480,058 features per<br />
patient.<br />
Because traditional machine learning algorithms cannot<br />
handle this amount of features, we then applied a feature<br />
selection step. To estimate the usefulness of a feature, we<br />
applied a Cox proportional hazards model on each feature.<br />
The resulting p-value indicates how well the feature<br />
corresponds with the known survival times for the training<br />
set. We ordered the features based on these scores, and<br />
picked only those that were uncorrelated with the others.<br />
This resulted in a final selection of 13 features, on which<br />
we applied several machine learning techniques. We<br />
compared the results of the Cox Proportional Hazards<br />
model, the Additive Hazards model and the Random<br />
Survival Forest.<br />
RESULTS & DISCUSSION<br />
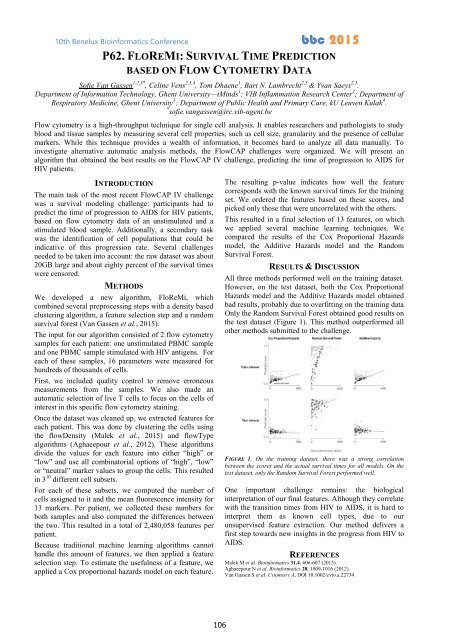
All three methods performed well on the training dataset.<br />
However, on the test dataset, both the Cox Proportional<br />
Hazards model and the Additive Hazards model obtained<br />
bad results, probably due to overfitting on the training data.<br />
Only the Random Survival Forest obtained good results on<br />
the test dataset (Figure 1). This method outperformed all<br />
other methods submitted to the challenge.<br />
FIGURE 1. On the training dataset, there was a strong correlation<br />
between the scores and the actual survival times for all models. On the<br />
test dataset, only the Random Survival Forest performed well.<br />
One important challenge remains: the biological<br />
interpretation of our final features. Although they correlate<br />
with the transition times from HIV to AIDS, it is hard to<br />
interpret them as known cell types, due to our<br />
unsupervised feature extraction. Our method delivers a<br />
first step towards new insights in the progress from HIV to<br />
AIDS.<br />
REFERENCES<br />
Malek M et al. Bioinformatics 31.4, 606-607 (<strong>2015</strong>).<br />
Aghaeepour N et al. Bioinformatics 28, 1009-1016 (2012).<br />
Van Gassen S et al. Cytometry A, DOI 10.1002/cyto.a.22734<br />
106