

bbc 2015
BBC2015_booklet
BBC2015_booklet

Create successful ePaper yourself
Turn your PDF publications into a flip-book with our unique Google optimized e-Paper software.
BeNeLux Bioinformatics Conference – Antwerp, December 7-8 <strong>2015</strong><br />
Abstract ID: O14<br />
Oral presentation<br />
10th Benelux Bioinformatics Conference <strong>bbc</strong> <strong>2015</strong><br />
O14. ENHANCEMENT OF IMAGING MASS SPECTROMETRY DATA<br />
THROUGH REMOVAL OF SPARSE INTENSITY VARIATIONS<br />
Yousef El Aalamat 1,2* , Xian Mao 1,2 , Nico Verbeeck 3 , Junhai Yang 4 , Bart De Moor 1,2 ,<br />
Richard M. Caprioli 4 , Etienne Waelkens 5,6 & Raf Van de Plas 3,4 .<br />
Department of Electrical Engineering (ESAT), STADIUS Center for Dynamical Systems, Signal Processing, and Data<br />
Analytics, KU Leuven 1 ; iMinds Medical IT, KU Leuven 2 ; Delft Center for Systems and Control, Delft University of<br />
Technology 3 ; Mass Spectrometry Research Center (MSRC),Vanderbilt University 4 ; Department of Cellular and<br />
Molecular Medicine, KU Leuven 5 ; Sybioma, KU Leuven 6 . *yelaalam@esat.kuleuven.be<br />
Imaging mass spectrometry (IMS) is rapidly evolving as a label-free, spatially resolved molecular imaging tool for the<br />
direct analysis of biological samples. However, mass spectrometry (MS) measurements are subject to different types of<br />
noise. In IMS, one of the most abundant noise types in ion images is the presence of localized intensity spikes, known<br />
also as sparse intensity variations, which occur on top of the biological ion distribution pattern. In this study, we develop<br />
a method that addresses the issue of sparse intensity noise. We use low-rank approximations of the IMS data to separate<br />
and filter sparse intensity variations from the MS signals. The efficiency of the developed method is tested using MS<br />
measurements of coronal sections of mouse brain and strong de-noising performance is demonstrated both along the<br />
spatial and the spectral domain.<br />
INTRODUCTION<br />
Imaging mass spectrometry (IMS) provides unique<br />
capabilities for biomedical and biological research.<br />
However, its measurements tend to be subject to different<br />
types of noise. One of the more abundant noise types in<br />
IMS are localized intensity spikes, which can be seen as<br />
sparse intensity variations on top of the true biological ion<br />
patterns. This kind of noise can have a substantial impact,<br />
particularly on low ion intensity measurements where the<br />
signal-to-noise ratio (SNR) can be significantly affected.<br />
We present a method to filter sparse intensity variations<br />
from IMS data, and demonstrate its use to de-noise IMS<br />
measurements both along the spatial and the spectral<br />
domain.<br />
METHODS<br />
We introduce a de-noising algorithm based on low-rank<br />
approximation, a concept from linear algebra. The method<br />
can separate sparse intensity variations from biological<br />
and tissue sample patterns, which hold up across multiple<br />
ions and pixels. This approach decomposes IMS data into<br />
two parts, namely a structured data matrix and a sparse<br />
data matrix. Since the noise tends to be sparse in nature, it<br />
will have a propensity to be collected into the sparse data<br />
part. The structured part tends to capture the de-noised<br />
IMS signals, effectively de-noising the ion images and the<br />
spectral profiles in the process. This de-noising method<br />
allows us to automatically filter sparse intensity variations<br />
from the underlying tissue signal without requiring any<br />
parameter tuning.<br />
RESULTS & DISCUSSION<br />
The filter method is demonstrated on two IMS<br />
experiments (one lipid-focused and one protein-focused)<br />
acquired from coronal sections of mouse brain. For the<br />
protein experiment, the tissue section was coated with<br />
sinapinic acid, and measurements were acquired using a<br />
Bruker AutoFlex MALDI-TOF/TOF in positive linear<br />
mode at a spatial resolution of 100 μm and with a mass<br />
range extending from m/z 3000 to 22000. For the lipid<br />
experiment, the tissue section was sublimated with 1,5-<br />
diaminonaphthalene, and the measurements were acquired<br />
using a Bruker AutoFlex MALDI-TOF/TOF in negative<br />
reflectron mode at a spatial resolution of 80 μm and with a<br />
mass range extending from m/z 400 to 1000. The case<br />
studies demonstrate robust de-noising performance,<br />
retrieving the underlying tissue signal efficiently and<br />
consistently using the structured data matrix. On the<br />
spatial side, we observe a clean-up effect in the spatial<br />
distributions of both high- and low-intensity ions. The<br />
effect is especially impactful for low-intensity ions,<br />
showing a strong increase in the amount of spatial<br />
structure that can be retrieved from low SNR<br />
measurements and revealing patterns that would have<br />
gone unnoticed otherwise. On the spectral side, we<br />
observe an improved SNR after applying the method.<br />
Thus, at the cost of computational analysis, the de-noising<br />
method described here provides a means of increasing the<br />
amount of information that can be extracted from an IMS<br />
experiment, without requiring user interaction or<br />
additional measurement.<br />
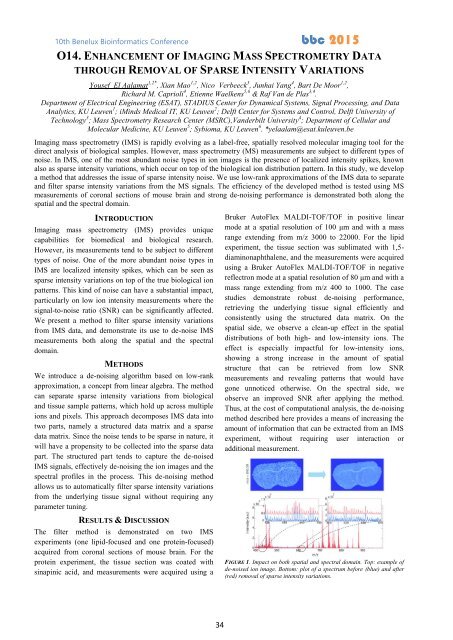
FIGURE 1. Impact on both spatial and spectral domain. Top: example of<br />
de-noised ion image. Bottom: plot of a spectrum before (blue) and after<br />
(red) removal of sparse intensity variations.<br />
34