

bbc 2015
BBC2015_booklet
BBC2015_booklet

You also want an ePaper? Increase the reach of your titles
YUMPU automatically turns print PDFs into web optimized ePapers that Google loves.
BeNeLux Bioinformatics Conference – Antwerp, December 7-8 <strong>2015</strong><br />
Abstract ID: P<br />
Poster<br />
10th Benelux Bioinformatics Conference <strong>bbc</strong> <strong>2015</strong><br />
P30. GALAHAD: A WEB SERVER FOR THE ANALYSIS OF DRUG EFFECTS<br />
FROM GENE EXPRESSION DATA<br />
Griet Laenen 1,2,* , Amin Ardeshirdavani 1,2 , Yves Moreau 1,2 & Lieven Thorrez 1,3 .<br />
Dept. of Electrical Engineering (ESAT), STADIUS Center for Dynamical Systems, Signal Processing and Data Analytics,<br />
KU Leuven 1 ; iMinds Medical IT Dept., KU Leuven 2 ; Dept. of Development and Regeneration @ Kulak, KU Leuven 3 .<br />
* griet.laenen@esat.kuleuven.be<br />
Galahad (https://galahad.esat.kuleuven.be) is a web-based application for the analysis of gene expression data from drug<br />
treatment versus control experiments, aimed at predicting a drug’s molecular targets and biological effects. Galahad<br />
provides data quality assessment and exploratory analysis, as well as computation of differential expression. Based on<br />
the obtained differential expression values, drug target prioritization and both pathway and disease enrichment can be<br />
calculated and visualized. Drug target prioritization is based on the integration of the gene expression data with a<br />
functional protein association network.<br />
INTRODUCTION<br />
Gene expression analysis is frequently employed to study<br />
the effects of drug compounds on cells. The observed<br />
transcriptional patterns can provide valuable information<br />
for identifying compound–protein inter-actions as well as<br />
resulting biological effects. To facilitate the analysis of<br />
this particular data type and enable an in-depth exploration<br />
of a drug’s mode of effect, we have developed Galahad 1 .<br />
INPUT<br />
The main input for Galahad are raw Affymetrix human,<br />
mouse or rat DNA microarray data derived from both<br />
untreated control samples and samples treated with a drug<br />
of interest. In addition, Galahad provides the possibility to<br />
start from differential expression data derived with other<br />
platforms to perform drug target prioritization and<br />
enrichment analysis.<br />
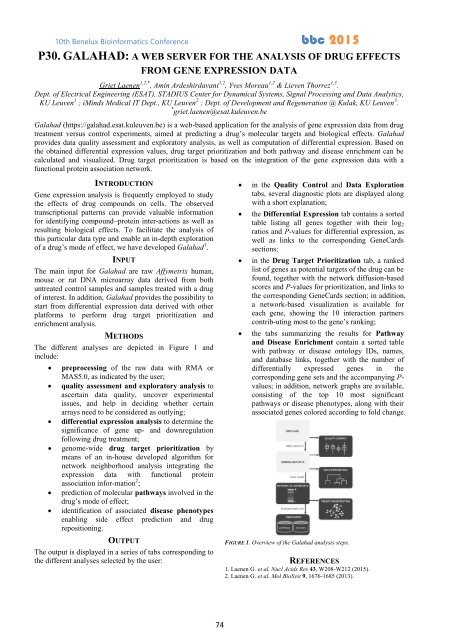
METHODS<br />
The different analyses are depicted in Figure 1 and<br />
include:<br />
<br />
<br />
<br />
<br />
<br />
<br />
preprocessing of the raw data with RMA or<br />
MAS5.0, as indicated by the user;<br />
quality assessment and exploratory analysis to<br />
ascertain data quality, uncover experimental<br />
issues, and help in deciding whether certain<br />
arrays need to be considered as outlying;<br />
differential expression analysis to determine the<br />
significance of gene up- and downregulation<br />
following drug treatment;<br />
genome-wide drug target prioritization by<br />
means of an in-house developed algorithm for<br />
network neighborhood analysis integrating the<br />
expression data with functional protein<br />
association infor-mation 2 ;<br />
prediction of molecular pathways involved in the<br />
drug’s mode of effect;<br />
identification of associated disease phenotypes<br />
enabling side effect prediction and drug<br />
repositioning.<br />
OUTPUT<br />
The output is displayed in a series of tabs corresponding to<br />
the different analyses selected by the user:<br />
<br />
<br />
<br />
<br />
in the Quality Control and Data Exploration<br />
tabs, several diagnostic plots are displayed along<br />
with a short explanation;<br />
the Differential Expression tab contains a sorted<br />
table listing all genes together with their log 2<br />
ratios and P-values for differential expression, as<br />
well as links to the corresponding GeneCards<br />
sections;<br />
in the Drug Target Prioritization tab, a ranked<br />
list of genes as potential targets of the drug can be<br />
found, together with the network diffusion-based<br />
scores and P-values for prioritization, and links to<br />
the corresponding GeneCards section; in addition,<br />
a network-based visualization is available for<br />
each gene, showing the 10 interaction partners<br />
contrib-uting most to the gene’s ranking;<br />
the tabs summarizing the results for Pathway<br />
and Disease Enrichment contain a sorted table<br />
with pathway or disease ontology IDs, names,<br />
and database links, together with the number of<br />
differentially expressed genes in the<br />
corresponding gene sets and the accompanying P-<br />
values; in addition, network graphs are available,<br />
consisting of the top 10 most significant<br />
pathways or disease phenotypes, along with their<br />
associated genes colored according to fold change.<br />
FIGURE 1. Overview of the Galahad analysis steps.<br />
REFERENCES<br />
1. Laenen G. et al. Nucl Acids Res 43, W208-W212 (<strong>2015</strong>).<br />
2. Laenen G. et al. Mol BioSyst 9, 1676-1685 (2013).<br />
74