

bbc 2015
BBC2015_booklet
BBC2015_booklet

Create successful ePaper yourself
Turn your PDF publications into a flip-book with our unique Google optimized e-Paper software.
BeNeLux Bioinformatics Conference – Antwerp, December 7-8 <strong>2015</strong><br />
Abstract ID: P<br />
Poster<br />
10th Benelux Bioinformatics Conference <strong>bbc</strong> <strong>2015</strong><br />
P53. FLOWSOM WEB: A SCALABLE ALGORITHM TO VISUALIZE AND<br />
COMPARE CYTOMETRY DATA IN THE BROWSER<br />
Arne Soete 2 , Sofie Van Gassen 1,2,3 , Tom Dhaene 1 , Bart N. Lambrecht 2,3 & Yvan Saeys 2,3 .<br />
Department of Information Technology, Ghent University-iMinds, Ghent, Belgium 1 ; Inflammation Research Center, VIB,<br />
Ghent, Belgium 2 ; Department of Respiratory Medicine, Ghent University Hospital, Ghent, Belgium 3 .<br />
We developed FlowSOM Web, a web-tool which visualizes cytometry data based on Self-Organizing Maps. Similar cells<br />
are clustered and visualized via star charts. This allows us to process and display millions of cells efficiently.<br />
Additionally, different biological samples (e.g. healthy versus diseased mice) can be compared.<br />
INTRODUCTION<br />
Cytometry data describes cell characteristics in<br />
biological samples. Cells are labeled with fluorescent<br />
antibodies and a flow cytometer measures the properties<br />
of millions of cells one by one. Biologists use this<br />
information to get more insight in diseases and to<br />
diagnose patients. Most of them still analyse this data<br />
manually to differentiate between the different cell types<br />
present. This is done by plotting the data in 2D scatter<br />
plots and selecting groups of cells in a hierarchical way.<br />
This process is called `gating'. Recently, the number of<br />
properties that can be measured simultaneously has<br />
strongly increased. As the number of possible 2D scatter<br />
plots increases exponentially with the number of<br />
properties measured, it becomes infeasible to analyze<br />
them all and relevant information that is present in the<br />
data might be missed.<br />
METHODS<br />
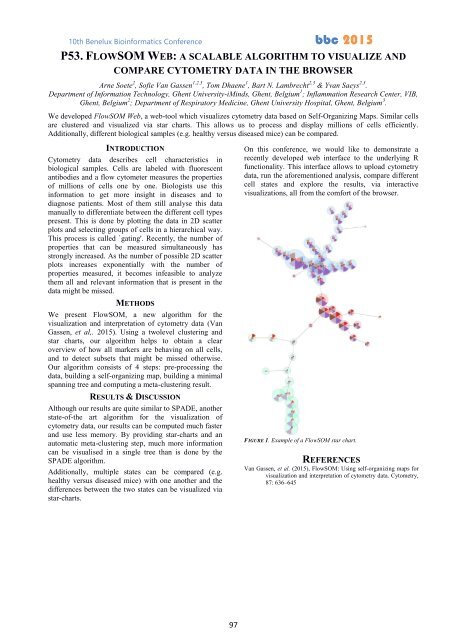
We present FlowSOM, a new algorithm for the<br />
visualization and interpretation of cytometry data (Van<br />
Gassen, et al,. <strong>2015</strong>). Using a twolevel clustering and<br />
star charts, our algorithm helps to obtain a clear<br />
overview of how all markers are behaving on all cells,<br />
and to detect subsets that might be missed otherwise.<br />
Our algorithm consists of 4 steps: pre-processing the<br />
data, building a self-organizing map, building a minimal<br />
spanning tree and computing a meta-clustering result.<br />
RESULTS & DISCUSSION<br />
Although our results are quite similar to SPADE, another<br />
state-of-the art algorithm for the visualization of<br />
cytometry data, our results can be computed much faster<br />
and use less memory. By providing star-charts and an<br />
automatic meta-clustering step, much more information<br />
can be visualised in a single tree than is done by the<br />
SPADE algorithm.<br />
Additionally, multiple states can be compared (e.g.<br />
healthy versus diseased mice) with one another and the<br />
differences between the two states can be visualized via<br />
star-charts.<br />
On this conference, we would like to demonstrate a<br />
recently developed web interface to the underlying R<br />
functionality. This interface allows to upload cytometry<br />
data, run the aforementioned analysis, compare different<br />
cell states and explore the results, via interactive<br />
visualizations, all from the comfort of the browser.<br />
FIGURE 1. Example of a FlowSOM star chart.<br />
REFERENCES<br />
Van Gassen, et al. (<strong>2015</strong>), FlowSOM: Using self-organizing maps for<br />
visualization and interpretation of cytometry data. Cytometry,<br />
87: 636–645<br />
97