

SHAPING THE FUTURE HOW CHANGING DEMOGRAPHICS CAN POWER HUMAN DEVELOPMENT
23XELCz
23XELCz

You also want an ePaper? Increase the reach of your titles
YUMPU automatically turns print PDFs into web optimized ePapers that Google loves.
134<br />
Actual pension<br />
coverage may be<br />
less than that<br />
promised by law<br />
services, and where there are budgetary constraints.<br />
Pensions with voluntary affiliation<br />
mechanisms, which are more likely for self-,<br />
part-time or informal employment, have lower<br />
coverage. Globally, more than half of employees<br />
are affiliated with a pension scheme, compared<br />
with 16 percent of the self-employed. Men are<br />
better covered than women. 65<br />
Besides understanding coverage, it is important<br />
to look at the adequacy of pension<br />
systems, which indicates the degree to which<br />
older people can rely financially on pensions.<br />
The variety and complexity of national pension<br />
systems, as well as the limited availability of<br />
data, make it difficult to find a comparable<br />
benchmark for measuring adequacy. Some indicators<br />
can provide an estimate, however, 66<br />
such as the replacement rate. It measures how<br />
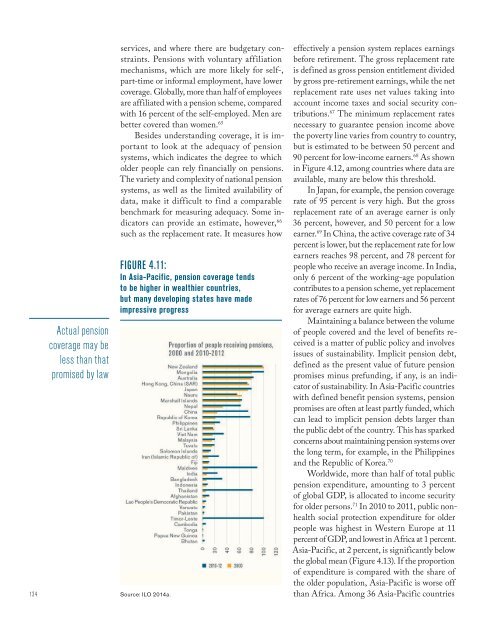
FIGURE 4.11:<br />
In Asia-Pacific, pension coverage tends<br />
to be higher in wealthier countries,<br />
but many developing states have made<br />
impressive progress<br />
Source: ILO 2014a.<br />
effectively a pension system replaces earnings<br />
before retirement. The gross replacement rate<br />
is defined as gross pension entitlement divided<br />
by gross pre-retirement earnings, while the net<br />
replacement rate uses net values taking into<br />
account income taxes and social security contributions.<br />
67 The minimum replacement rates<br />
necessary to guarantee pension income above<br />
the poverty line varies from country to country,<br />
but is estimated to be between 50 percent and<br />
90 percent for low-income earners. 68 As shown<br />
in Figure 4.12, among countries where data are<br />
available, many are below this threshold.<br />
In Japan, for example, the pension coverage<br />
rate of 95 percent is very high. But the gross<br />
replacement rate of an average earner is only<br />
36 percent, however, and 50 percent for a low<br />
earner. 69 In China, the active coverage rate of 34<br />
percent is lower, but the replacement rate for low<br />
earners reaches 98 percent, and 78 percent for<br />
people who receive an average income. In India,<br />
only 6 percent of the working-age population<br />
contributes to a pension scheme, yet replacement<br />
rates of 76 percent for low earners and 56 percent<br />
for average earners are quite high.<br />
Maintaining a balance between the volume<br />
of people covered and the level of benefits received<br />
is a matter of public policy and involves<br />
issues of sustainability. Implicit pension debt,<br />
defined as the present value of future pension<br />
promises minus prefunding, if any, is an indicator<br />
of sustainability. In Asia-Pacific countries<br />
with defined benefit pension systems, pension<br />
promises are often at least partly funded, which<br />
can lead to implicit pension debts larger than<br />
the public debt of the country. This has sparked<br />
concerns about maintaining pension systems over<br />
the long term, for example, in the Philippines<br />
and the Republic of Korea. 70<br />
Worldwide, more than half of total public<br />
pension expenditure, amounting to 3 percent<br />
of global GDP, is allocated to income security<br />
for older persons. 71 In 2010 to 2011, public nonhealth<br />
social protection expenditure for older<br />
people was highest in Western Europe at 11<br />
percent of GDP, and lowest in Africa at 1 percent.<br />
Asia-Pacific, at 2 percent, is significantly below<br />
the global mean (Figure 4.13). If the proportion<br />
of expenditure is compared with the share of<br />
the older population, Asia-Pacific is worse off<br />
than Africa. Among 36 Asia-Pacific countries