

SHAPING THE FUTURE HOW CHANGING DEMOGRAPHICS CAN POWER HUMAN DEVELOPMENT
23XELCz
23XELCz

You also want an ePaper? Increase the reach of your titles
YUMPU automatically turns print PDFs into web optimized ePapers that Google loves.
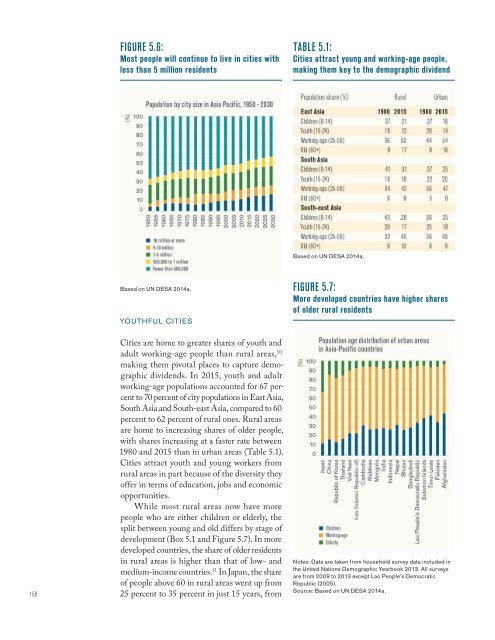
FIGURE 5.6:<br />
Most people will continue to live in cities with<br />
less than 5 million residents<br />
TABLE 5.1:<br />
Cities attract young and working-age people,<br />
making them key to the demographic dividend<br />
Based on UN DESA 2014a.<br />
Based on UN DESA 2014a.<br />
YOUTHFUL CITIES<br />
FIGURE 5.7:<br />
More developed countries have higher shares<br />
of older rural residents<br />
158<br />
Cities are home to greater shares of youth and<br />
adult working-age people than rural areas, 10<br />
making them pivotal places to capture demographic<br />
dividends. In 2015, youth and adult<br />
working-age populations accounted for 67 percent<br />
to 70 percent of city populations in East Asia,<br />
South Asia and South-east Asia, compared to 60<br />
percent to 62 percent of rural ones. Rural areas<br />
are home to increasing shares of older people,<br />
with shares increasing at a faster rate between<br />
1980 and 2015 than in urban areas (Table 5.1).<br />
Cities attract youth and young workers from<br />
rural areas in part because of the diversity they<br />
offer in terms of education, jobs and economic<br />
opportunities.<br />
While most rural areas now have more<br />
people who are either children or elderly, the<br />
split between young and old differs by stage of<br />
development (Box 5.1 and Figure 5.7). In more<br />
developed countries, the share of older residents<br />
in rural areas is higher than that of low- and<br />
medium-income countries. 11 In Japan, the share<br />
of people above 60 in rural areas went up from<br />
25 percent to 35 percent in just 15 years, from<br />
Notes: Data are taken from household survey data included in<br />
the United Nations Demographic Yearbook 2013. All surveys<br />
are from 2009 to 2013 except Lao People’s Democratic<br />
Republic (2005).<br />
Source: Based on UN DESA 2014a.