Annex 2: List of Services Imported by Nigeria (US$ 000) Code 2003 2004 2005 2006 2007 2008 2009 2010 2011 '200 Total services 5,714,800 5,973,190 6,623,500 13,923,900 18,345,200 24,376,700 18,696,600 21,411,480 24,573,304 2CS Commercial services 5,714,800 5,973,190 6,383,622 12,115,060 15,552,950 22,576,700 16,487,270 19,941,552 22,472,364 '205 Transportation 1,283,540 1,463,000 2,801,370 3,298,310 4,982,240 6,869,130 6,091,408 8,524,130 8,055,511 '291 Government services, n.i.e. 239,878 1,808,840 2,792,250 1,800,000 2,209,356 1,469,928 2,100,939 '253 Insurance services 4,124 274,685 209,672 1,013,930 391,665 503,357 703,492 '260 Financial services 25,627 30,725 8,765 31,798 49,453 33,852 317,737 '247 -- Telecommunication services 144,707 168,562 191,616 194,844 321,636 272,767 212,120 '266 Royalties and license fees 49,853 67,500 84,277 172,659 190,342 208,413 224,222 213,221 '263 -- Computer services 143,134 165,851 189,533 205,659 180,876 119,711 159,071 '249 Construction services 45,508 53,009 60,259 67,103 43,425 129,431 88,698 '287 Personal, cultural and recreational services 294 342 389 433 11,354 52,641 79,088 '237 -- Business travel 88,551 241,273 928,029 726,924 758,095 1,101,965 '241 -- -- Health-related expenditure 2,092 994,391 1,067,550 1,793,360 882,354 1,000,647 1,101,826 '242 -- -- Personal travel - Education related expenditure 84,437 1,063,580 4,729,890 2,168,697 2,395,521 2,672,267 '243 -- -- Other personal travel 64,537 979,812 2,327,450 1,234,130 1,432,720 1,722,986 '246 -- Postal and courier services 14,312 16,671 18,951 39,638 21,522 12,804 17,327 '264 -- Information services 7,533 9,653 9,975 16,507 5,268 4,484 5,849 '272 -- Operational leasing services 28,780 968,780 50,307 1,002,450 1,184,710 1,114,109 1,868,954 '273 Misc. business, profess. & technical 2,861,110 3,765,110 5,939,978 3,166,170 2,965,577 3,363,063 4,152,253 Sources: ITC, UNCTAD, WTO joint dataset. Calculations based on national source, IMF statistics: www.intracen.org/itc/market-info-tools/trade-statistics/ Figures are in US$ thousands. 143
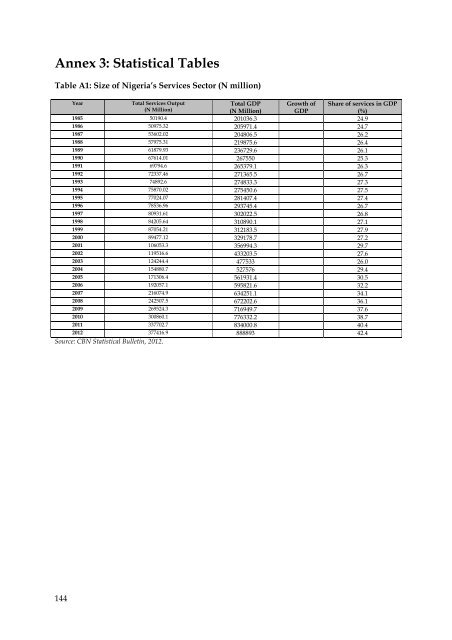
Annex 3: Statistical Tables Table A1: Size of Nigeria’s Services Sector (N million) Year Total Services Output (N Million) Total GDP (N Million) Growth of GDP Share of services in GDP (%) 1985 50190.4 201036.3 24.9 1986 50975.32 205971.4 24.7 1987 53602.02 204806.5 26.2 1988 57975.31 219875.6 26.4 1989 61879.93 236729.6 26.1 1990 67614.01 267550 25.3 1991 69794.6 265379.1 26.3 1992 72337.46 271365.5 26.7 1993 74892.6 274833.3 27.3 1994 75870.02 275450.6 27.5 1995 77024.07 281407.4 27.4 1996 78536.96 293745.4 26.7 1997 80931.61 302022.5 26.8 1998 84205.64 310890.1 27.1 1999 87054.21 312183.5 27.9 2000 89477.12 329178.7 27.2 2001 106053.3 356994.3 29.7 2002 119516.6 433203.5 27.6 2003 124244.4 477533 26.0 2004 154880.7 527576 29.4 2005 171306.4 561931.4 30.5 2006 192057.1 595821.6 32.2 2007 216074.9 634251.1 34.1 2008 242507.5 672202.6 36.1 2009 269524.3 716949.7 37.6 2010 300860.1 776332.2 38.7 2011 337702.7 834000.8 40.4 2012 377416.9 888893 42.4 Source: CBN Statistical Bulletin, 2012. 144
- Page 1 and 2:
SERVICES EXPORTS FOR GROWTH AND DEV
- Page 4 and 5:
CONTENTS Acronyms and Abbreviations
- Page 6 and 7:
ACRONYMS AND ABBREVIATIONS ACP ADC
- Page 8 and 9:
FESPACO Festival Panafricain du Cin
- Page 10:
TVET TWA UACE UAE UBA UCL UEMOA UEP
- Page 13 and 14:
Each of the five case studies was t
- Page 15 and 16:
xiv
- Page 17 and 18:
Scope and Coverage of Case Studies
- Page 19 and 20:
transferring technology, skills, an
- Page 21 and 22:
Government Policies that Made a Dif
- Page 23 and 24:
availability of hotel accommodation
- Page 25 and 26:
2. Successful exports in one mode o
- Page 27 and 28:
TYPOLOGY OF FOUR MODES OF EXPORTING
- Page 29 and 30:
areas of the service, for example,
- Page 31 and 32:
to become the market leader in the
- Page 33 and 34:
Data from international organisatio
- Page 35 and 36:
Figure 1: Share of Services Subsect
- Page 37 and 38:
Figure 2: Structural Decomposition
- Page 39 and 40:
Air Transport Services Coverage in
- Page 41 and 42:
GTP on Air Transport Services Regar
- Page 43 and 44:
Table 6: Aviation Sector Performanc
- Page 45 and 46:
Ethiopia’s consideration of the s
- Page 47 and 48:
Definition Selected for This Study
- Page 49 and 50:
Boeing 767-200ER. EAL made history
- Page 51 and 52:
other construction and navigation f
- Page 53 and 54:
Market Structure International pass
- Page 55 and 56:
Ethiopian destinations. Revenue gen
- Page 57 and 58:
tourism, as well as the transaction
- Page 59 and 60:
independently, and are intermediate
- Page 61 and 62:
Table 10: Strengths, Weaknesses, Op
- Page 63 and 64:
Yamoussoukro Decision, the guidelin
- Page 65 and 66:
Geographical Positioning and Human
- Page 67 and 68:
EAL has remained flexible when nece
- Page 69 and 70:
South Africa, Zambia, and Tanzania.
- Page 71 and 72:
Bibliography Abeyratne, Ruwantissa
- Page 73 and 74:
Ethiopian Ministry of Finance and E
- Page 75 and 76:
Annex 1: Questionnaire Used for the
- Page 77 and 78:
Annex 2: Pictorial Representations
- Page 79 and 80:
64
- Page 82 and 83:
3. BANKING SERVICES: A CASE STUDY O
- Page 84 and 85:
institutions are in charge of servi
- Page 86 and 87:
witnessed a decline between 2007 an
- Page 88 and 89:
hand, the eight countries of the Un
- Page 90 and 91:
(f) Evaluate the opportunities for
- Page 92 and 93:
significant share of services outpu
- Page 94 and 95:
Nigeria has several natural and cul
- Page 96 and 97:
Sector Male Female Total Activities
- Page 98 and 99:
Annex 3 (Table A1) also shows the a
- Page 100 and 101:
Sector Industrial Sector Energy Tou
- Page 102 and 103:
matters regarding trade negotiation
- Page 104 and 105:
to the changes in interest rates by
- Page 106 and 107:
hoped that these activities will ra
- Page 108 and 109: economic controls. Specifically, th
- Page 110 and 111: Resuscitation and enforcement of do
- Page 112 and 113: All financial institutions require
- Page 114 and 115: Current Banking Services Activities
- Page 116 and 117: Bank Total Assets Foreign Locations
- Page 118 and 119: 1961 1963 1965 1967 1969 1971 1973
- Page 120 and 121: is a membership-driven institute wh
- Page 122 and 123: Table 17: CIBN Membership Statistic
- Page 124 and 125: Table 20: Share of Banks’ Profit
- Page 126 and 127: 2009, it increased after conditions
- Page 128 and 129: Contribution of Banking Services to
- Page 130 and 131: Year Agriculture Manufacturing Serv
- Page 132 and 133: Figure 5: Percentage Growth of UBA
- Page 134 and 135: generally suggests that the growth
- Page 136 and 137: epresentative offices in Beijing, D
- Page 138 and 139: 1989 16. Ecobank Côte d’Ivoire a
- Page 140 and 141: Figure 13: Percentage Growth of ETI
- Page 142 and 143: premiums on conversion of local cur
- Page 144 and 145: and technology driven. 62 Therefore
- Page 146 and 147: From previous reforms, to the 2005
- Page 148 and 149: come to dominate the system in the
- Page 150 and 151: In conclusion, it may not be as mea
- Page 152 and 153: BGL Research. Getting Banks to Lend
- Page 154 and 155: Musuku, Thilasoni, et al. Increasin
- Page 156 and 157: Business Day. ‘Ghana Approves Tak
- Page 160 and 161: Table A2: Share of Services Value A
- Page 162 and 163: Table A3: Share of Services Value A
- Page 164 and 165: Table A4: Nigeria’s Trade in Serv
- Page 166: Table A8: Total Number of Employees
- Page 169 and 170: Information Systems, Networks and I
- Page 171 and 172: enterprises. Preferences may includ
- Page 173 and 174: Growth Rate (%) Share of GDP (%) Fi
- Page 175 and 176: Table 1: Examples of Approved Proje
- Page 177 and 178: principles included in the WTO Tele
- Page 179 and 180: Layer 2 includes telecommunications
- Page 181 and 182: firms involved in the wholesale/ret
- Page 183 and 184: Figure 4: Cross-border Exports of
- Page 185 and 186: 9 days. Thus the application of ICT
- Page 187 and 188: software; system integration; compu
- Page 189 and 190: years’ experience in BPO in Seneg
- Page 191 and 192: 3. Proactive policies in services,
- Page 193 and 194: Due to labour shortages for young g
- Page 195 and 196: Institutions When it comes to servi
- Page 197 and 198: Financial Attractiveness Other fact
- Page 199 and 200: Proactive Policies to Promote Expor
- Page 201 and 202: Table 13: SWOT Analysis: Senegal as
- Page 203 and 204: promote more coherent efforts in su
- Page 205 and 206: Bibliography ANDS. Second Follow-up
- Page 207 and 208: Annex 1: Evaluation Framework for t
- Page 209 and 210:
Annex 3: Standards and Certificatio
- Page 211 and 212:
Sectors or Subsectors Mobile cellul
- Page 213 and 214:
Annex 5: Short Version of the Quest
- Page 215 and 216:
1. Is the classification system use
- Page 218 and 219:
5. CULTURAL INDUSTRIES: A CASE STUD
- Page 220 and 221:
will help generate new opportunitie
- Page 222 and 223:
Mode 4, Presence of Natural Persons
- Page 224 and 225:
(d) Evaluate the factors that have
- Page 226 and 227:
Organisation of the Report The pres
- Page 228 and 229:
Percent Table 2: Balance of Service
- Page 230 and 231:
(notably the balance of payments) c
- Page 232 and 233:
With the exception of the travel co
- Page 234 and 235:
goods and products that are not ban
- Page 236 and 237:
Table 7: Involved Private and Publi
- Page 238 and 239:
particular. Because cultural produc
- Page 240 and 241:
copyrights 25 ), artistic expressio
- Page 242 and 243:
Ministers of Culture to endorse the
- Page 244 and 245:
Categories of Members 2000 2001 200
- Page 246 and 247:
lack of funding, a high level of di
- Page 248 and 249:
Success Story: Biz’Art Production
- Page 250 and 251:
Success Story: Cartel 38 Aware of t
- Page 252 and 253:
museums are currently operated comm
- Page 254 and 255:
Market Structure Providing adequate
- Page 256 and 257:
Human Capital Formation The continu
- Page 258 and 259:
creative goods were greatly at odds
- Page 260 and 261:
Figure 5: Different Types of Cultur
- Page 262 and 263:
The fees paid by the advertisers (c
- Page 264 and 265:
Estimated Employment Generated by C
- Page 266 and 267:
Table 30: Exports of Artefacts and
- Page 268 and 269:
more visitors than FESTIMA. From th
- Page 270 and 271:
impact of these imports on the bala
- Page 272 and 273:
Exports Total % Main Export Market
- Page 274 and 275:
First, the lack of available data a
- Page 276 and 277:
Moreover, the unequal distribution
- Page 278 and 279:
telecommunication networks), and in
- Page 280 and 281:
improve and support the development
- Page 282 and 283:
Inclusion of Cultural Services in E
- Page 284 and 285:
To ensure the provision of financia
- Page 286 and 287:
To improve market intelligence and
- Page 288 and 289:
Table 41: Practical Tools for the P
- Page 290 and 291:
Competitiveness Issues associations
- Page 292 and 293:
Competitiveness Issues services sec
- Page 294 and 295:
Bibliography Articles and Books CE,
- Page 296 and 297:
Paugam, J.M. (2013). Trade in Servi
- Page 298 and 299:
Table 45: Distribution of Cultural
- Page 300 and 301:
Annex 2: Questionnaire for the Priv
- Page 302 and 303:
3.2 Pour les festivals / Musées et
- Page 304 and 305:
4.2 Les ressources humaines qualifi
- Page 306:
Une règlementation en terme de dro
- Page 309 and 310:
There are factors which have favore
- Page 311 and 312:
The UN’s Provisional Central Prod
- Page 313 and 314:
Because education is designated as
- Page 315 and 316:
Global and Regional Trends in Trans
- Page 317 and 318:
(a) joint degrees between different
- Page 319 and 320:
education services imports. Accordi
- Page 321 and 322:
2006 2007 2008 2009 2010 2011 Finan
- Page 323 and 324:
Services Sector Export Strategy As
- Page 325 and 326:
tailoring, hairdressing, catering,
- Page 327 and 328:
improvement measures in delivering
- Page 329 and 330:
state of Kenya, Tanzania, and Ugand
- Page 331 and 332:
Figure 2: Enrolment of Foreign Stud
- Page 333 and 334:
Strengths, Weaknesses, Opportunitie
- Page 335 and 336:
tended to attract more students loc
- Page 337 and 338:
total government expenditure, publi
- Page 339 and 340:
Uganda’s declining market share o
- Page 341 and 342:
management processes leading to inc
- Page 343 and 344:
educational cooperation between Uga
- Page 345 and 346:
Uganda Christian University Uganda
- Page 347 and 348:
the university closer to its foreig
- Page 349 and 350:
At present there are no internation
- Page 351 and 352:
Using Social Media for University P
- Page 353 and 354:
338 6) Grant all universities disco
- Page 355 and 356:
Bibliography Alpen Capital. GCC Edu
- Page 357 and 358:
Tierney, William G., and Findlay, C
- Page 359 and 360:
Name of Institution Address Details
- Page 361 and 362:
iii. Students from outside Africa _
- Page 363 and 364:
9. Does your institution collaborat
- Page 365 and 366:
If so please elaborate below. _____
- Page 368 and 369:
AUTHOR BIOGRAPHIES Abiodun Surajude
- Page 370 and 371:
awareness of the relationships amon
- Page 372:
African Union Headquarters P.O. Box